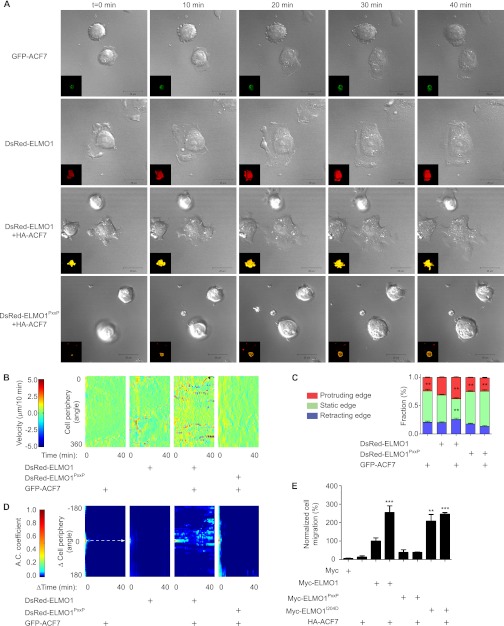
FIGURE 3.
The ELMO1-ACF7 complex increases the persistence of membrane protrusions. A, live imaging reveals that cells expressing both ELMO1 and ACF7 develop long membrane protrusions. Serum-starved CHO LR73 cells expressing pDsRed-ELMO1 or pDsRed-ELMO1PxxP, with or without pEGFPC1-ACF7, were visualized by live laser-scanning microscopy upon plating on fibronectin-coated plates. A selection of time lapse acquisitions from a representative experiment is shown (see Videos 1 and 4 for supplemental Fig. S3 for the complete video sequences). Inset, overlay of DsRed±GFP. Scale bars, 20 μm. B, expression of ELMO1 and ACF7 increases membrane velocity. Membrane velocity was measured on the representative acquisitions shown in A to derive membrane velocity maps. The pseudocolor scale provides a reference for the membrane velocity across time shown in the maps. C, the membrane velocities determined in B were classified in three categories (protruding, static, or retracting) and quantified for each of the indicated conditions. ANOVA tests and Bonferroni's multiple comparison were performed to compare each category for the different conditions (**, p < 0.01; error bars represent S.E., minimum of eight cells/condition). D, the ACF7-ELMO1 complex increases the persistence of membrane protrusions. Autocorrelation maps for the indicated conditions are shown. The maps were cropped from Δcell periphery (−180 to 180 degree) and from Δtime (0–40 min). The dashed arrow indicates the temporal correlation function at Δcell periphery = 180 °. A pseudocolor scale provides a reference for the autocorrelation coefficient (A.C.). E, the ELMO1-ACF7 interaction promotes cell motility. Migration of CHO LR73 cells, transfected with the indicated plasmids, was evaluated by Transwell migration assays. The ELMO1 condition was arbitrarily set at 100% (**, p < 0.005; ***, p < 0.001; by ANOVA test and Bonferroni's multiple comparison; error bars represent S.E., n = 3).

