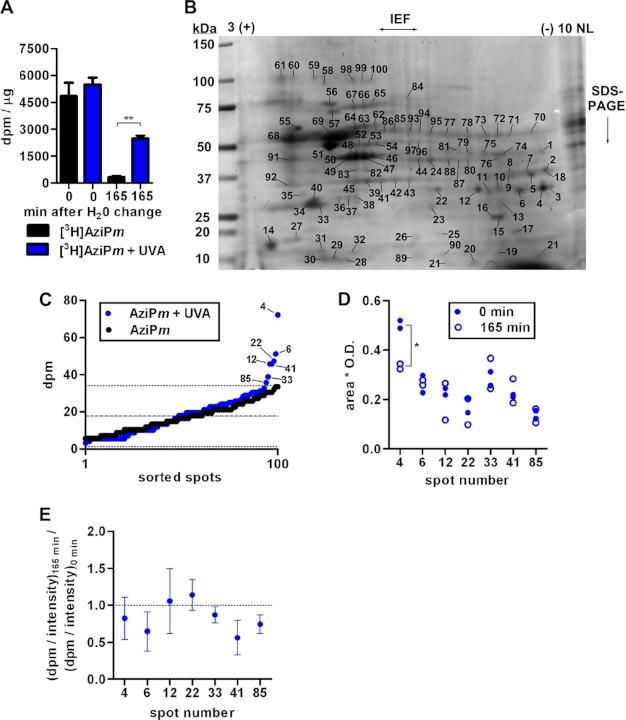
FIGURE 2.
A, quantitation of dpm normalized to protein amount in CNS tissue of tadpoles treated with AziPm ± UVA for 10 min. Data are from 3 experiments per treatment (10 tadpoles per experiment). Mean ± S.E. is shown, and data were analyzed by one-way ANOVA with Bonferroni's post hoc test comparing dpm within each time point (p < 0.01). B, representative Coomassie Blue-stained gel of tadpole neuronal membrane protein separated first by isoelectric focusing on a 3–10 non-linear (NL) pH gradient strip followed by SDS-PAGE. C, mean dpm of spots excised from gels of tissue isolated immediately after in vivo [3H]AziPm ± UVA treatment. dpm values were arranged in ascending order, with measurements from select spots indicated. The dashed line indicates background mean from + UVA gels with the dotted line indicating two standard deviations. D, Coomassie Blue stain intensity quantified from in vivo gel spots. Spot 4 was found to decrease with a two-tailed Student's t test (p < 0.05). E, the ratio (dpm/intensity)165 min divided by (dpm/intensity)0 min shows the change in the fraction of photolabeled protein over the emergence period. S.D. is shown, and a ratio of 1 would indicate no change.

