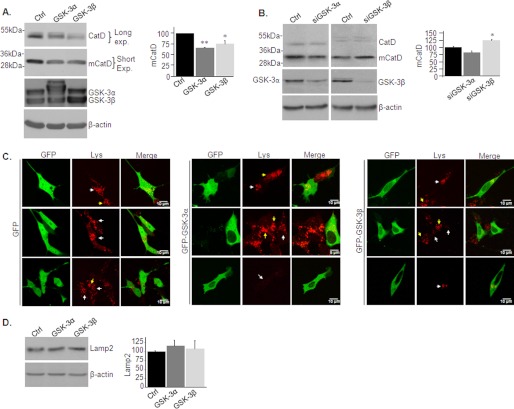
FIGURE 5.
GSK-3 impairs lysosomal acidification in SHSY-5Y cells. A, SHSY-5Y cells were infected with adenovirus coding for GSK-3α or GSK-3β. The levels of CatD (∼46–52 kDa) and mCatD (∼32 kDa) were determined by immunoblot analysis. Long and short exposures are shown to allow detection of CatD and mCatD within the linear range. Control cells were infected with a β-gal-coding adenovirus (Ctrl). Expression of GSK-3α/β are shown in the middle and right panels. B, SHSY-5Y cells were transfected with siRNA targeting GSK-3α or GSK-3β. The levels of CatD (∼46–52 kDa) and mCatD (∼32 kDa) were determined by immunoblot analysis. Control cells were transfected with scrambled control siRNA (Ctrl). Densitometry analysis of indicated proteins is shown on the right of each panel. The results are the means of three independent experiments ± S.E. *, p < 0.05; **, p < 0.005. C, SH-SY5Y cells were transfected with GFP-GSK-3α or GFP-GSK-3β constructs. Control cells were transfected with a GFP coding construct. The cells were stained with LysoTracker Red (Lys) and imaged by confocal microscopy. Representative images are shown as indicated. The arrows indicate acidic lysosomes in the transfected cells (white arrows) or in the nontransfected cells (yellow arrows). The fluorescence images in the top panels represent Z-projection image stacks (23 images). The scale bars represent 5 or 10 μm. D, levels of Lamp2 were determined in cells from C. Equal protein loads were verified by β-actin blots (A, B, and D).

