FIGURE 6.
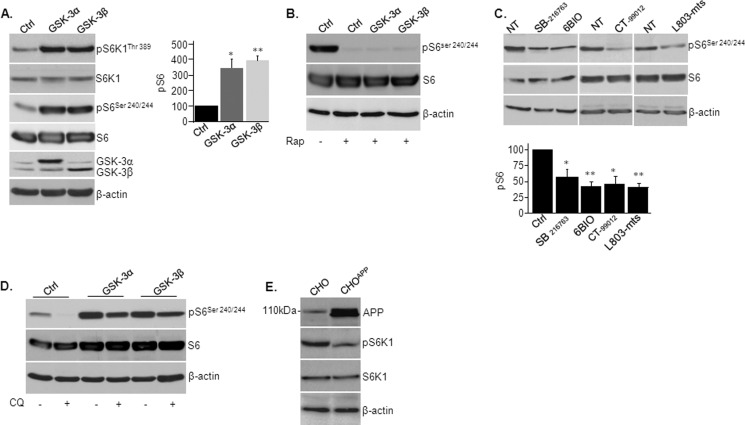
Regulation of mTOR activity by GSK-3, lysosomes, and APP. A, SHSY-5Y cells were infected with adenovirus coding for GSK-3α or GSK-3β. Phosphorylation levels of indicated mTOR targets were determined by immunoblot analysis. Densitometry analysis of indicated proteins is shown at the right. B, SHSY-5Y cells were infected with adenovirus coding for GSK-3α or GSK-3β and were treated with rapamycin (Rap) (50 nm, 2 h). Phosphorylation levels of S6 were determined by immunoblot analysis. Control cells (Ctrl) were infected with a β-gal-coding adenovirus. C, SHSY-5Y cells were treated with GSK-3 inhibitors SB-216763 (10 μm), CT-99012 (20 μm), 6-Bio (5 μm), and L803-mts (40 μm) for 5 h. The phosphorylation levels of S6 were determined by immunoblot analysis. NT, nontreated. D, SHSY-5Y cells infected with adenovirus coding for GSK-3α or GSK-3β and were treated with chloroquine (CQ) (30 μm, 2 h). Phosphorylation levels of S6 was determined by immunoblot analysis. E, phosphorylation levels of S6K1 were determined in CHO-APP751 and control CHO cells by immunoblot analysis. Equal protein loads were verified by β-actin blots.

