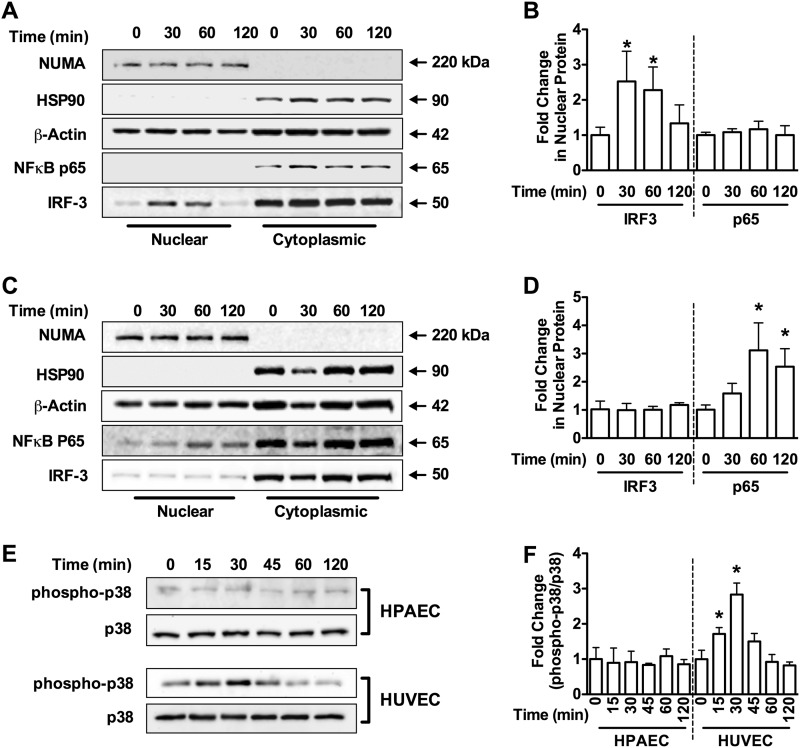
FIGURE 6.
Differential signaling in HPAECs versus HUVECs. Western blot analysis for NUMA (150 kDa, nuclear marker), HSP90 (90 kDa, cytoplasmic marker), β-actin (42 kDa), NFκB-p65 (65 kDa), and IRF3 (45 kDa) in cytoplasmic and nuclear fractions from HPAECs (A) and HUVECs (C) treated with HMGB1 (1 μg/ml) for the indicated times. Blots are representative of three independent experiments and are quantified in B and D, respectively. E, Western blot analysis for phospho-p38 MAPK and total p38 MAPK in HPAECs and HUVECs for the indicated times. Blots are representative of three independent experiments and are quantified in F. Graphs represent the mean ± S.E. (error bars) of three independent experiments. Analysis of variance; *, p < 0.05 versus unstimulated control.

