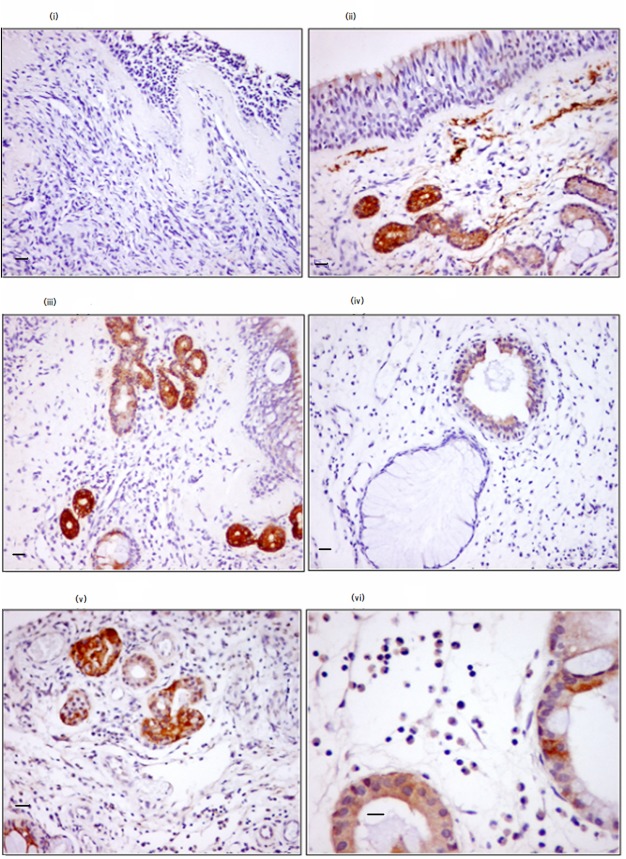
FIGURE 2.
Relationship between eosinophils infiltration and VIP expression within nasal tissue. The brown color represents VIP expression. i, control subject; ii–vi, patients with ACRS. Note the expression of VIP by the epithelial cells (ii), some stromal cells (ii–vi), and the infiltrating eosinophils (vi). Staining intensity was as follows: − for the control, in the epithelium and subepithelium layer; ++ for ACRS in the epithelium and subepithelium layer. Magnification was ×200 for i–v images and ×400 for vi. Scale bars, 25 μm (i–v) and 50 μm (vi).

