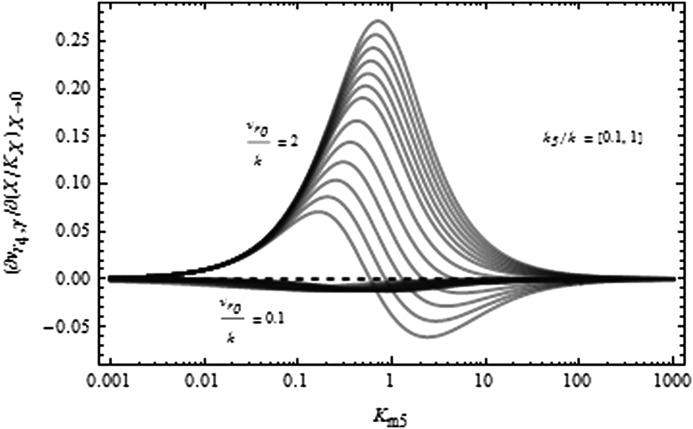
FIGURE 2.
Initial variation of Aβ production rate at low GSI concentration. On the y axis is shown the slope change of the production rate of Aβ in response to low inhibitor concentration for a range of Michaelis-Menten constant of α-secretase with respect to C99, Km5. The two families of curves shown were calculated using vr0 0.1 and 2, and for each value, different k5/k ratios uniformly distributed in the [0.1, 1] range. The positive (negative) values represent a rise (decrease) in Aβ rate production when a small amount of inhibitor is added into the system.

