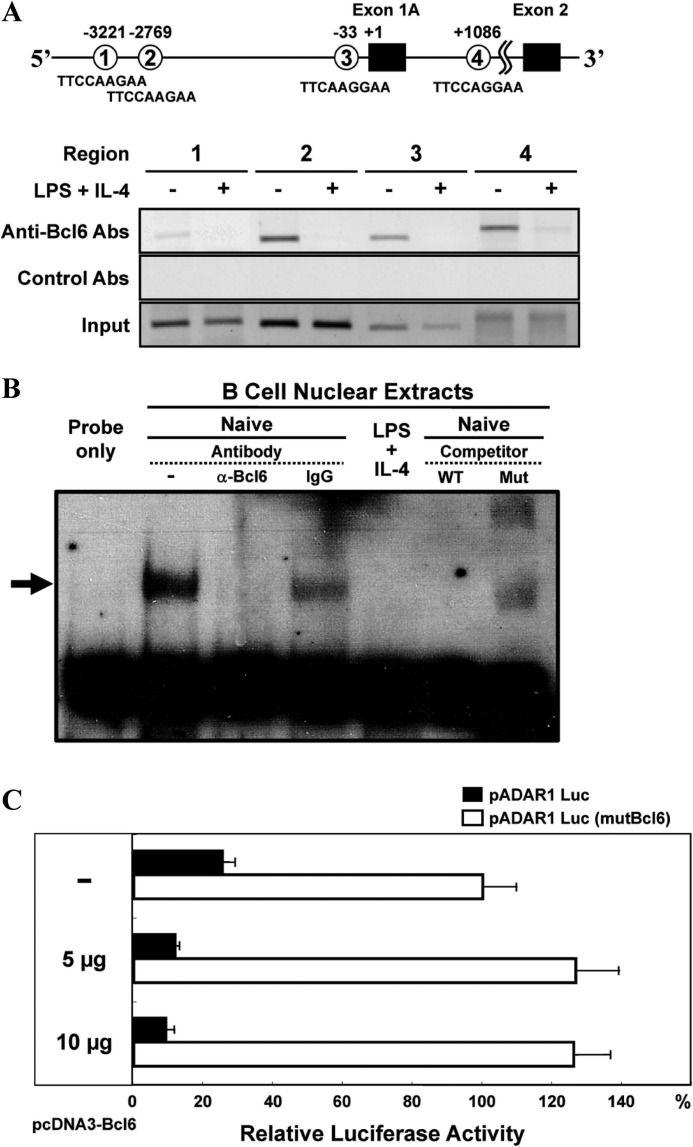
FIGURE 3.
Bcl6-binding to putative Bcl6-binding sequences in the ADAR1 promoter region. A and B, splenic IgM B cells from WT mice were stimulated with LPS and IL-4 for 6 h. A, ChIP analysis for Bcl6 binding to the ADAR1 promoter region of B cells. DNA samples were analyzed by PCR with primers specific for each indicated region, and 10% of input DNA (bottom) was analyzed by PCR. Data presented are as a representative of three independent experiments. B, EMSA for Bcl6-binding to region 3. An arrow indicates the retarded bands. For cold probe competition experiments, 50-fold molar of unlabeled competitor oligonucleotides was included in binding reactions with nuclear extracts from naive IgM B cells. Data are presented as a representative of three independent experiments. C, repression of ADAR1 promoter activity by Bcl6. Ramos cells were transfected with pADAR1 Luc (filled bar) or pADAR1 Luc (mutBcl6) (open bar) and serial dilution of pcDNA3-Bcl6. Luciferase activity of these cells transfected with pADAR1 Luc (mutBcl6) was as 100%. Data are presented as the mean ± S.D. from three independent experiments.

