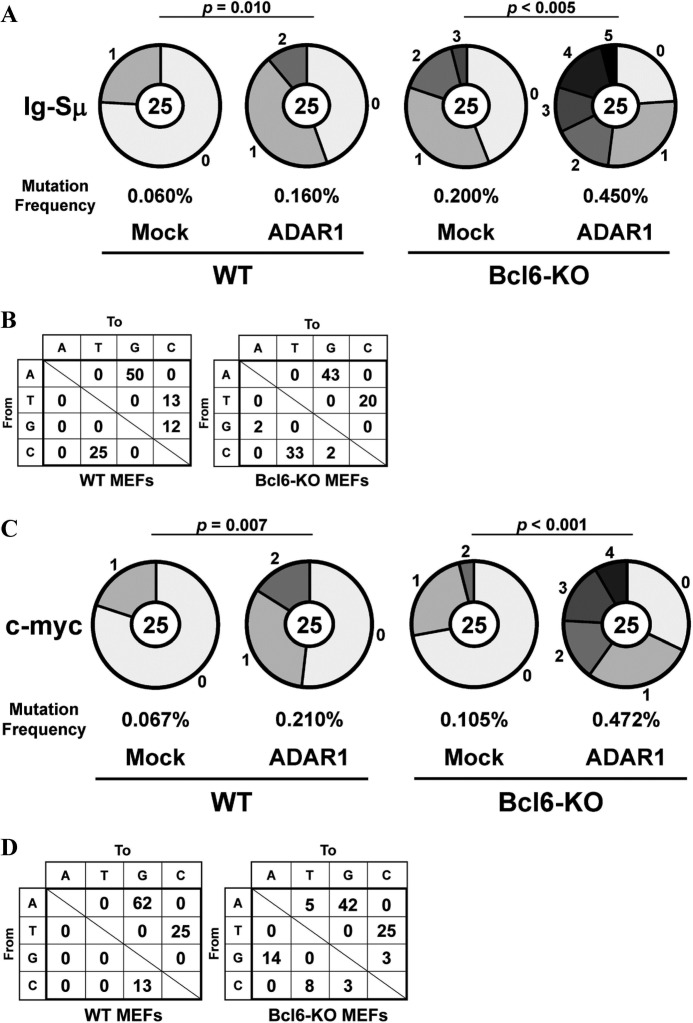
FIGURE 5.
Somatic mutations in the Ig-Sμ region and the c-myc gene of MEFs transfected with the ADAR1 gene. WT and Bcl6-KO MEFs at P5 transfected with the ADAR1-EGFP fusion (ADAR1) gene or the Mock-EGFP (Mock) gene were cultured for 3 days. EGFP+ MEFs were isolated by FACS, and the Ig-Sμ region and the c-myc gene were sequenced. A and C, pie charts indicate mutations in the Ig-Sμ region (A) and the c-myc gene (C) of ADAR1-transfected MEFs. Sectors of the pie are proportional to the number of sequences with a given number of mutations. The number of sequences is shown in the center of the pie chart. A frequency of mutations is described below the pie chart. B and D, types of nucleotide substitutions in the Ig-Sμ region (B) and the c-myc gene (D) of ADAR1-transfected MEFs are shown as percentages of total mutations.

