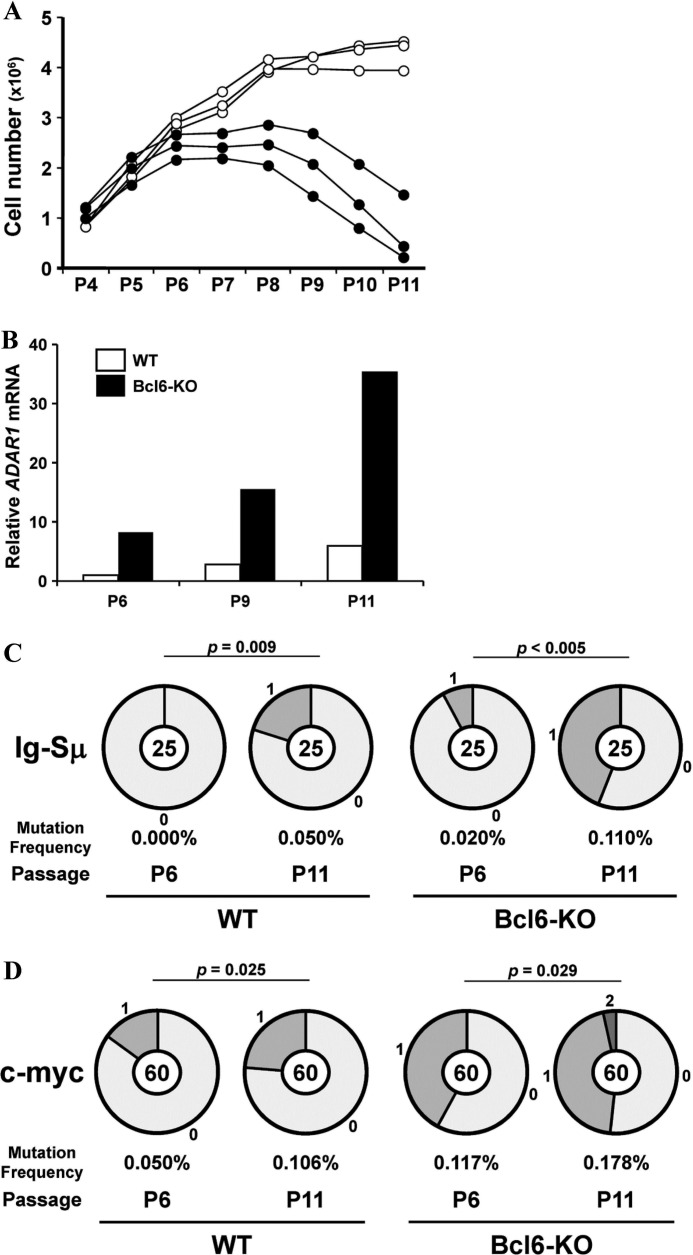
FIGURE 6.
Somatic mutations in the Ig-Sμ region and the c-myc gene of MEFs at the senescent stage. MEFs from WT and Bcl6-KO mice were cultured by the 3T3 protocol. A, cell numbers of WT (open circle) and Bcl6-KO (filled circle) MEFs were demonstrated. B, amounts of ADAR1 mRNA in MEFs were analyzed by real-time qRT-PCR. Data are presented as representative of three independent experiments. C and D, pie charts indicate mutations in the Ig-Sμ region (C) and the c-myc gene (D) of MEFs. Sectors of the pie are proportional to the number of sequences with a given number of mutations. The number of sequences is shown in the center of the pie chart. A frequency of mutations is described below the pie chart.

