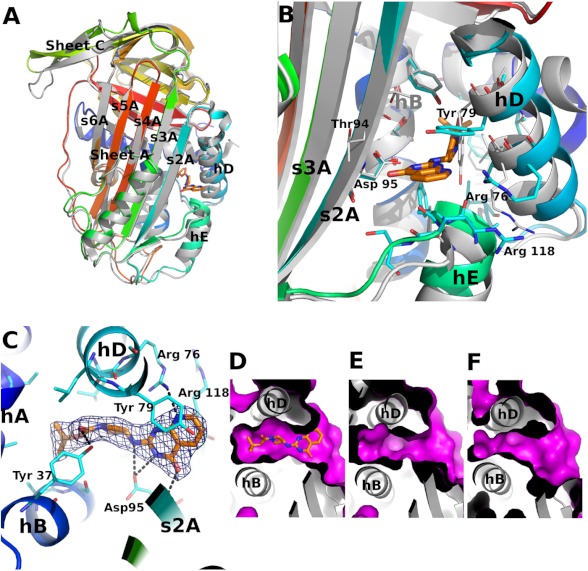
FIGURE 4.
The structure of latent PAI-1 in complex with AZ3976. A, comparison of the latent PAI-1·AZ3976 holostructure with the latent PAI-1 apoform (PDB code 1DVN) (18). PAI-1 is colored by sequence from blue (N-terminal) to red (C-terminal). The inhibitor is shown in stick representation. The structure of the latent PAI-1 apostructure is shown as a gray ribbon representation. B, comparison of the AZ3976 binding site in ligand bound and free latent PAI-1. C, AZ3976 binding site in latent PAI-1. The Fo − Fc map calculated using the refined AZ3979-bound structure of latent PAI-1 is contoured at 3σ. D–F show the surface of the ligand binding site in three different forms of PAI-1. D, latent ligand complexed (this work); E, latent (PDB code 1DVN) (18); and F, active (PDB code 1DVM) (18). The magenta-colored surface describes the solvent accessible area in the region of AZ3979 binding. The nomenclature for the secondary structure is adopted from Stein and Chotia (50).

