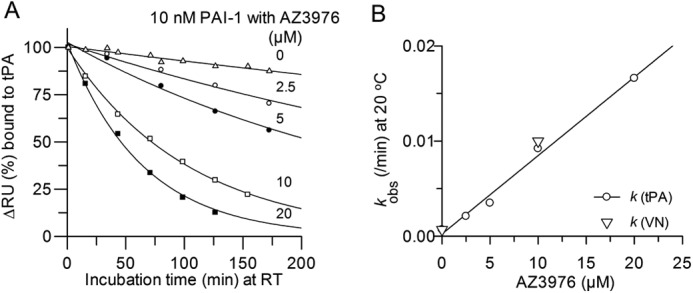
FIGURE 6.

Interaction of PAI-1 with captured tPA and effect of incubation time with AZ3976. A, initial rate, measured as ΔRU, the change in RU 10 s after injection over tPA, as a function of the incubation time (min) of 10 nm PAI-1 with AZ3976 at different concentrations at 20 °C. Lines are drawn by fitting a single exponential decay to the data. B, rate constants from the data in A (circles) for single exponential decay of PAI-1, or from the data in Fig. 5 (triangles) from binding to VN, versus the concentration of AZ3976. The line was drawn by a linear fit with a slope of 14 m−1·s−1.
