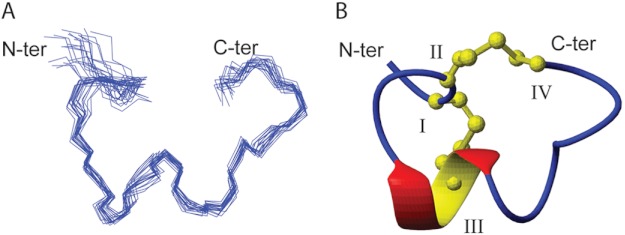
FIGURE 5.
The three-dimensional structure of α-conotoxin TxIB. A, a stereoview of a family of the 20 lowest energy structures of α-CTx TxIB. Structures are superimposed over all the backbone atoms between residues 2–16. B, ribbon representation of the mean structure of α-CTx TxIB. The termini are labeled with N-terminal and C-terminal, and the cysteine residues are labeled with their residue numbers. The α-helical region between residues Pro6 and Arg9 is shown in red and yellow, and disulfide bonds are shown in yellow in ball-and-stick representation. The structures were generated using MOLMOL.

