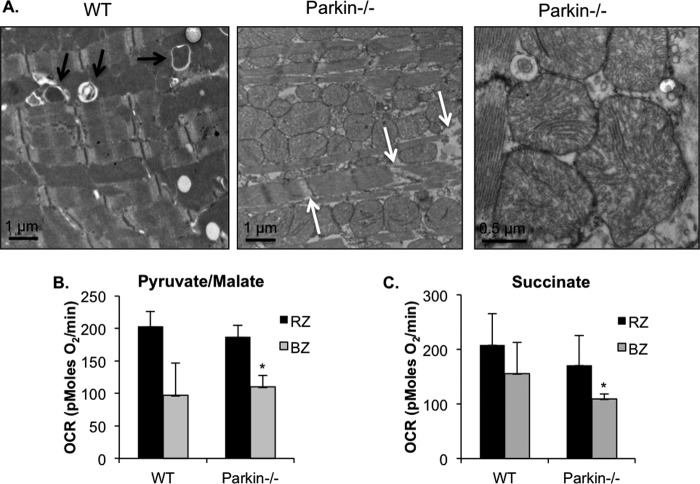
FIGURE 7.
Accumulation of damaged mitochondria in Parkin-deficient hearts after MI. A, ultrastructural analysis by transmission electron microscopy of WT and Parkin−/− myocytes in the border zone of the infarct 4 h after MI. Black arrows indicate autophagosomes, and white arrows indicate disrupted contractile elements. B and C, oxygen consumption rates (OCR) of mitochondria in the remote zone (RZ) and border zone (BZ) 4 h after MI with pyruvate/malate (B) or succinate/rotenone (C) as substrates. Mean ± S.E. (n = 5 for WT, n = 6 for Parkin−/−).

