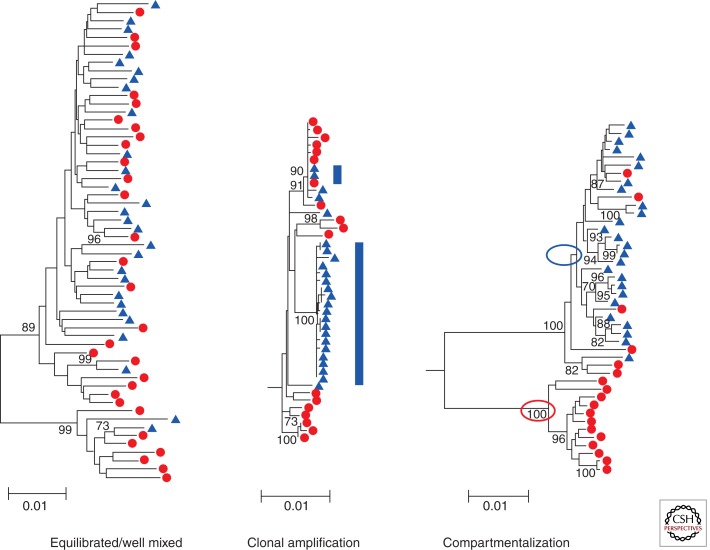
Figure 3.
Phylogenetic trees demonstrating different relationships between viral populations. In these trees are examples of viral populations in blood (red) and semen (blue). On the left is an example of well-mixed populations with the sequences derived from blood and semen intermingled. In the middle is an example of clonal amplification (blue bars) in which a nearly homogeneous set of sequences appears only in the semen creating a population that is distinct from the blood. On the right is an example of compartmentalization in which the sequences in the semen are distinct from the bulk of the sequences in the blood. These two lineages are indicated by the circles. In addition, sequences present in the seminal tract appear to have migrated back into the blood compartment. (These trees were originally published in Anderson et al. 2010; reprinted with permission from the author.)

