
FIGURE 3.
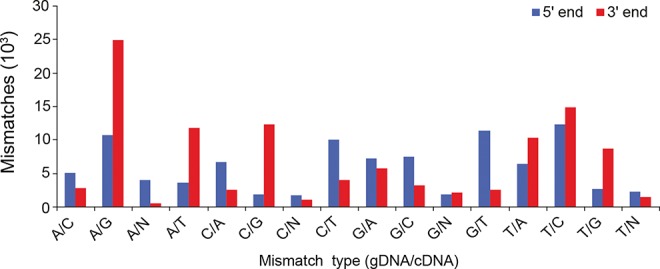
The iSeq protocol enriches for A > G mismatch at the 3′ end of the reads from the I-RNA library. The graph displays the distribution of I-RNA mismatches when mapped to the mouse genome. 5′ end mismatches are shown in red, while 3′ end mismatches are shown in blue. Note the preponderance of A > G mismatches at the 3′ end, consistent with sites of inosine editing.