
FIGURE 6.
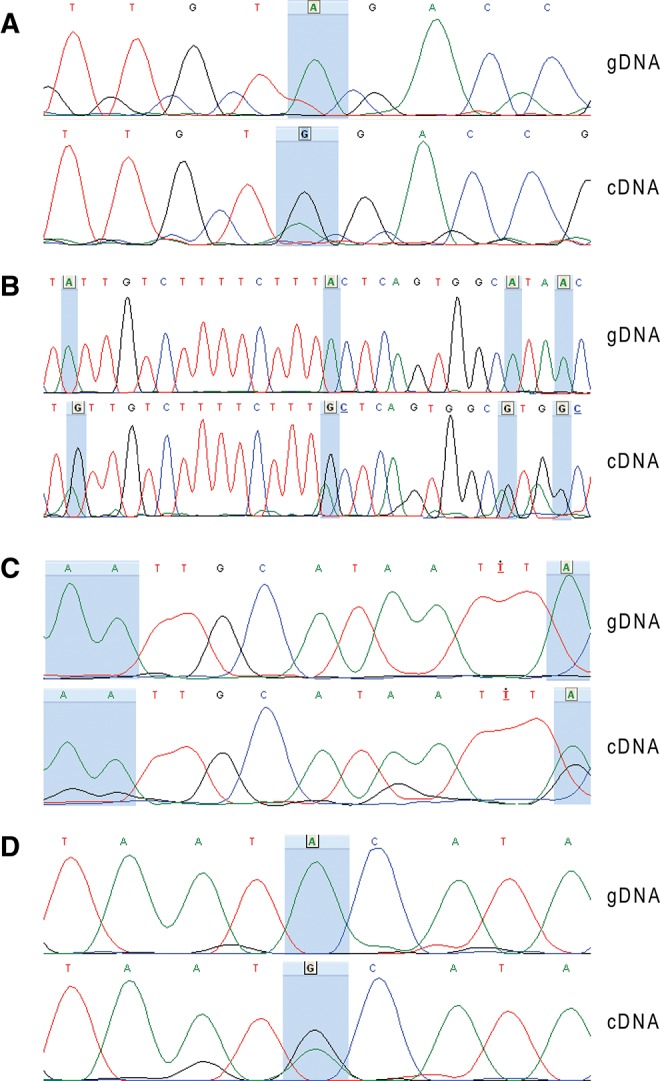
Chromatograms of the sequences of the genome and transcript at nine high-confidence editing loci. The loci are located in five different transcripts: (A) the site ID_5463 is in Ebna1bp2, (B) the sites ID_6291–94 (from right to left) are in Kcnip4_bis, (C) the sites ID_984–86 (from right to left) are in Rpa1, (D) and the site ID_4361 is in Zc3h6. For each candidate, the chromatogram of the genomic sequence (gDNA) is aligned to the chromatogram of the transcript’s sequence (cDNA). The level of adenine is represented in green, the level of guanine is in black, the level of thymine in red, and the level of cytosine in blue. The blue highlights indicate the high-confidence editing sites characterized by iSeq.