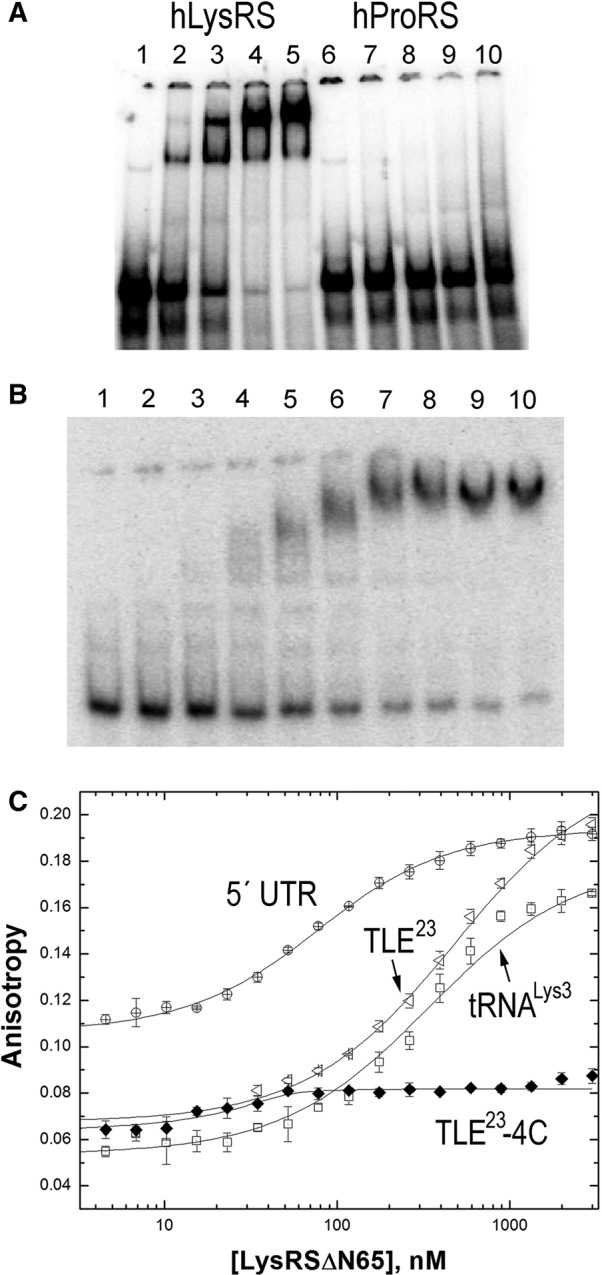
FIGURE 3.

Binding studies investigating the specificity of hLysRS/TLE interaction. (A) Electrophoretic mobility shift assays performed with 25 nM 105-nt 32P-labeled HXB2 PBS/TLE RNA and 0, 0.50, 1.0, 2.0, or 3.0 μM hLysRS (lanes 1–5) or hProRS (lanes 6–10). (B) Electrophoretic mobility shift assays were performed with 30 nM PBS/TLE and 0, 0.12, 0.18, 0.26, 0.40, 0.59, 0.89, 1.3, 2.0, or 3.0 μM hLysRSΔN65 (lanes 1–10). (C) FA binding assay wherein varying amounts of hLysRSΔN65 were incubated with 20–50 nM fluorescently labeled TLE23, TLE23-4C, 330-nt 5′ UTR, or tRNALys3. The averages of three experiments with standard deviations are shown.
