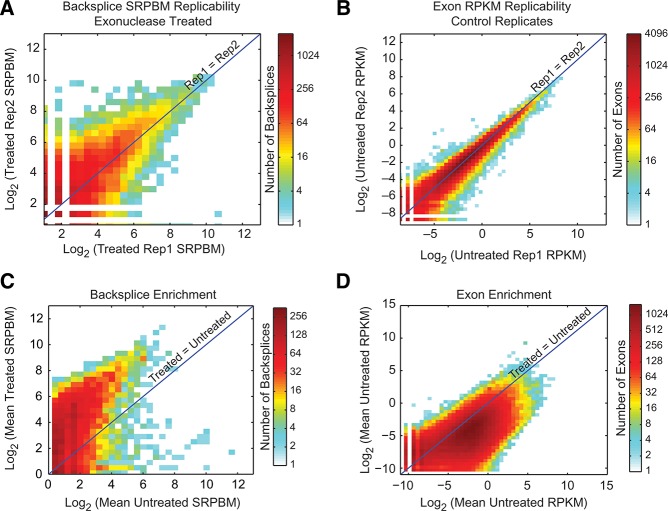
FIGURE 2.
CircleSeq enriches for backsplice junctions. Two-dimensional histograms showing normalized backspliced read count (SRPBM) or normalized exon coverage (RPKM) between two samples or replicates. (A) Coverage of backsplice reads in RNase R-treated replicates over all distinct backsplice species (R2 = 0.579). (B) Coverage of exons in mock treated replicates (R2 = 0.91). (C) Average backsplice coverage in RNase R-treated against mock treated RNA-seq showing enrichment of most backsplice species by RNase R. (D) Mean normalized exon coverage in annotated exon sequences in RNase R-treated against mock treated RNA-seq showing depletion of the majority of species by RNase R.

