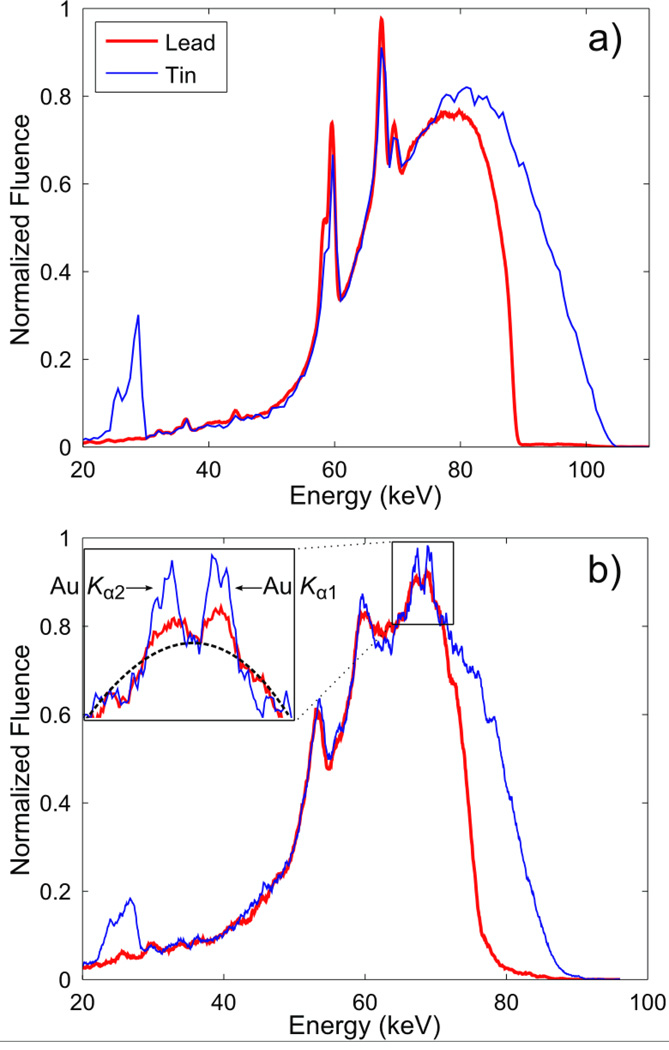
Figure 2.
(a) Measured energy spectra of 105 kVp x-rays filtered by 1 mm of lead and 0.9 mm of tin. The x-ray beams with these spectra were incident onto the imaging phantom for XFCT. Spectra are normalized to have the same maximum value. The relative amount of photons above the K-edge of gold is greater with the tin filter. (b) Typical photon spectra emitted from the imaging phantom showing the Compton scatter background and gold fluorescence peaks (GNP concentration at 2 wt. %). Spectra were measured by a CdTe detector at a 90° angle to the central axis of lead-/tin-filtered incident beams. The inset shows more detail around the gold K-shell fluorescence peaks. The dotted line is an example fit to the scatter background. It can be seen that the fluorescence photons constitute a small fraction of the overall signal.

