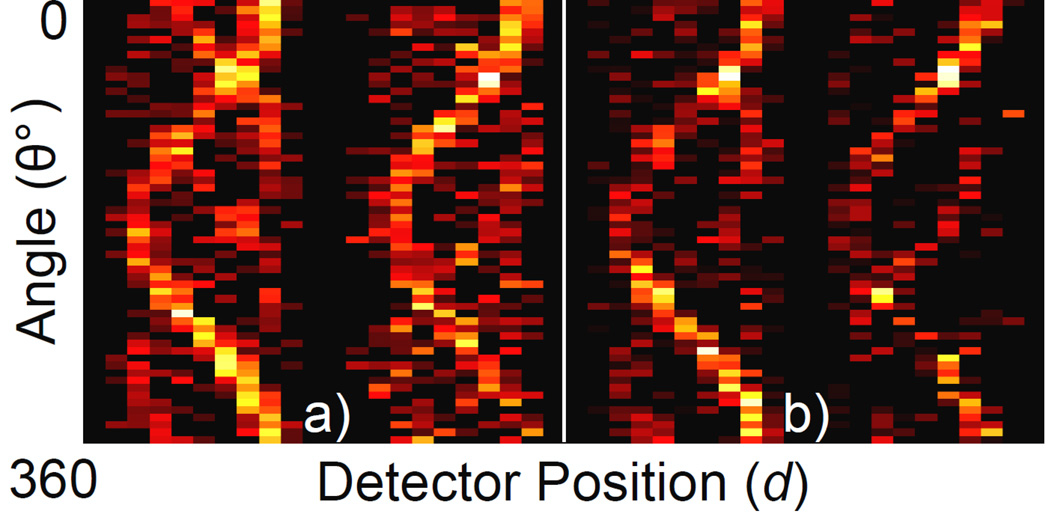
Figure 3.
Measured sinograms for the 3 cm-diameter phantom. (a) tin-filtered polychromatic beam, 1 minute exposure per projection. (b) lead-filtered polychromatic beam, 3 minute exposure per projection. Since detectors were placed on both sides of the phantom, the full sinogram dataset contains data from both sides (i.e., left and right sinograms in each panel of this figure).

