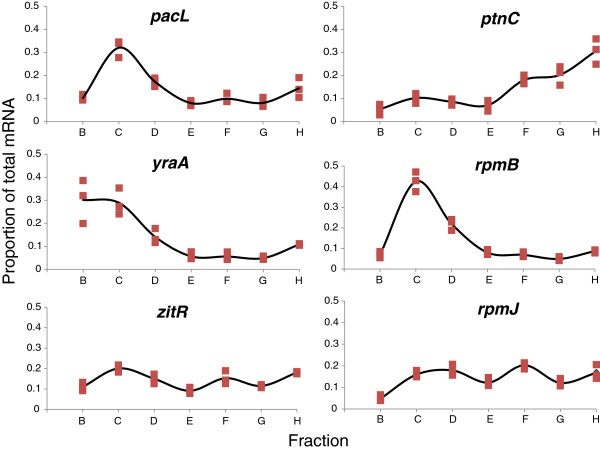
Figure 3.
mRNA proportions between fractions B to H for six chosen genes. For a given gene, its proportions of mRNA molecules in each fraction from B to H were calculated as described in Equation 6 of Methods. Square symbols represent data from the three polysomal profile experiments. The black line is the plot of the mean mRNA proportion value.

