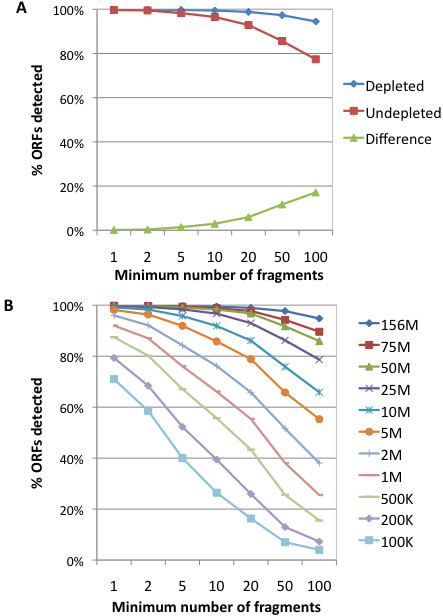
Figure 2.

Coverage of annotated E. coli K-12 ORFs by ultra-deep RNA-Seq data. In each plot, the X-axis denotes the minimum threshold of fragments/ORF A) Coverage of ORFs by data derived from rRNA-depleted and undepleted samples. B) Coverage of ORFs by full and sampled datasets of the rRNA-depleted sample.
