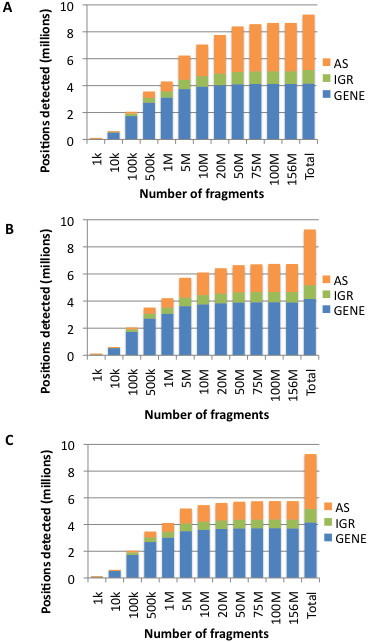
Figure 3.

Coverage of E. coli K-12 genome as sequencing depth increases. Annotations of genomic positions was conducted as described in the Figure 1 legend. The bar labeled “Total” represents all positions in the E. coli K-12 genome. A) without gDNA subtraction. B) with 0.5% gDNA subtraction. C) with 1% gDNA subtraction.
