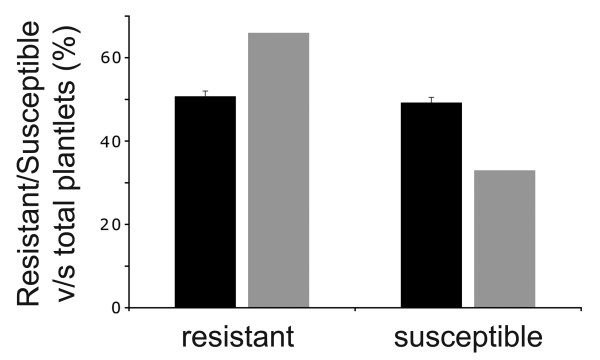
Figure 1.
Segregation of the p5cs2 mutant allele in a self-pollinated p5cs1 p5cs2/P5CS2 population. Percentage of resistant versus total plantlets (black left column) or susceptible versus total plantlets (black right column) grown under sulfadiazine selection are shown. The corresponding gray columns represent the percentages expected if the p5cs1 p5cs2/P5CS2 were not a gametophytic mutant. Values represent the means of six independent experiments ± SE.

