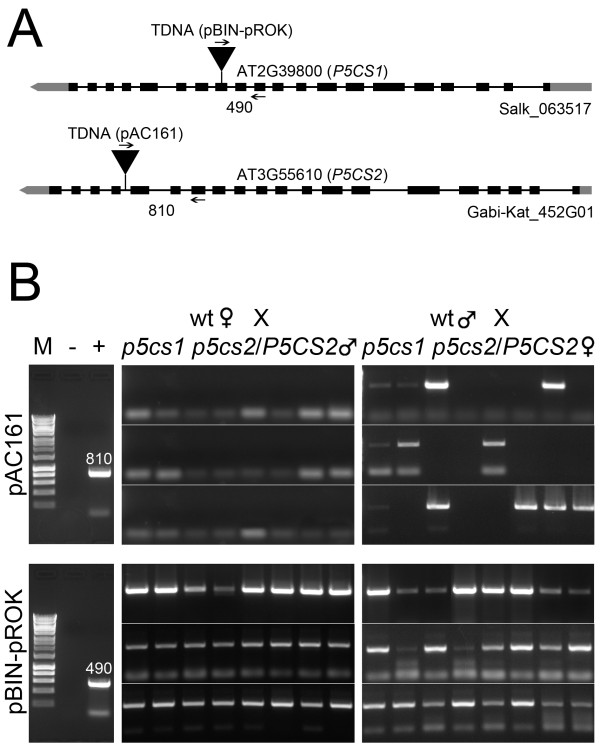
Figure 3.
Molecular analysis of reciprocal crosses between p5cs1 p5cs2/P5CS2 mutants and wild type. (A) Schematic drawing of the insertional mutant p5cs1(Salk_063517) and p5cs2 (Gabi-Kat _452G01). The position of the T-DNA insertion, the location of the PCR primers used for genotyping, and the expected length of the PCR products are shown for P5CS1 (At2G39800), and P5CS2 (At3G55610). (B) PCR amplification of T-DNA insertions associated to P5CS2 (PAC161 T-DNA, top panels) and P5CS1 (pROK T-DNA, bottom panels) in reciprocal crosses between p5cs1 p5cs2/P5CS2 and wild type. Samples from 24 randomly chosen outcrossed plantlets are shown. The Results shown on top panels indicate that the P5CS2 mutation is never transmitted to the progeny (0/24) when p5cs1 p5cs2/P5CS2 serves as a male (top panel left), but is normally segregated (12/24), when serves as a female. Negative and positive controls are shown in the leftmost panel, relative to the amplification of wt (− ,top and bottom leftmost panel), p5cs2/P5CS2 (+, top leftmost panel) and p5cs1 (+, bottom leftmost panel) parental genotypes. The numbers next to the PCR products represent the expected molecular weight expressed in Kb for the P5CS2-T-DNA (top panel), and P5CS1-T-DNA (bottom panel) junction fragments, respectively.

