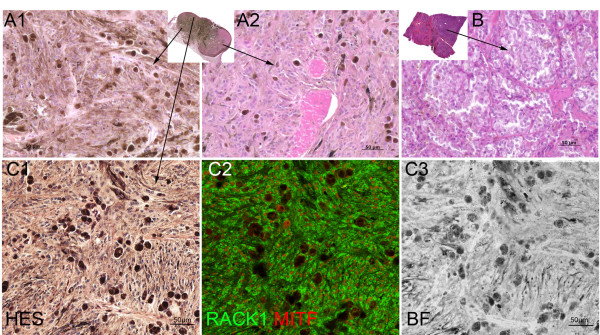
Figure 4.
Variability of histological features of horse melanomas and uniformity of RACK1/MITF labeling. (A-B): Sections of two different melanomas with hematoxylin-eosin-safran staining, with their respective low magnification in the inserts. Note the variability in pigmentation between tumors (A, B) and in different areas of the same tumor (A1, A2). (C): Histological staining of a pigmented area from A with ovoid and spindled cells (C1), and low power capture of RACK1 (green) - MITF (red) labeling in the adjacent section (C2), (C3) bright-field corresponding to C2. Note RACK1 signal uniformity in the different areas. Bar: 50 μm.

