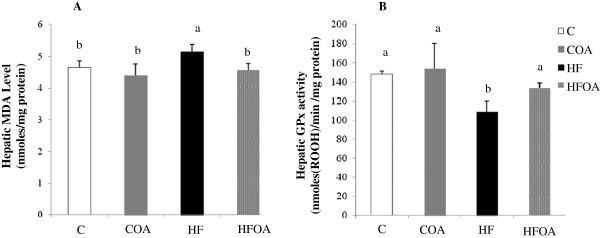
Figure 4.
Effect of O. aurita supplementation of standard or high fat diets on hepatic oxidative stress after 7 weeks of treatment. (A): effect of O. aurita on hepatic MDA level (p = 0.006); (B): effect of O. aurita on hepatic GPx activity (p = 0.002). Values are expressed as the mean ± SD (n = 5). Values bearing different superscript letters are significantly different from each other. After a one-way ANOVA, Student–Newman–Keuls (SNK) multiple comparison test, the results are arranged in increasing order from left to right: a > b > c (p < 0.05). C, control; COA, control + O. aurita; HF, high fat; HFOA, high fat + O. aurita.

