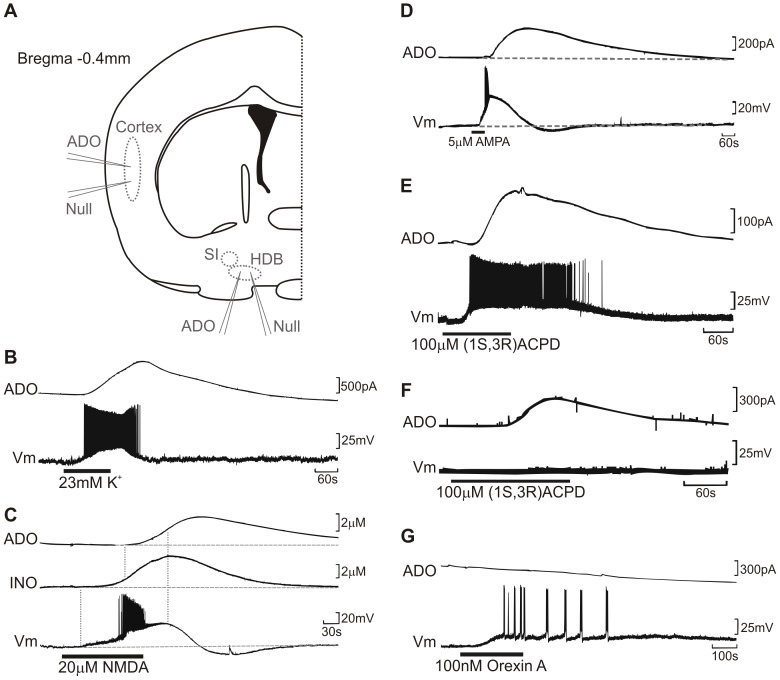
Figure 1. Release of adenosine by depolarisation and agonists.
(a) Schematic diagram of a coronal slice indicating location of sensor placements. SI: substantia innominata; HDB: horizontal arm of the diagonal band. Adenosine release was measured as the peak ADO’ signal from BFB slices as measured by inserted biosensors combined with whole cell patch recordings of BFB neurons in current clamp. All panels show raw data from representative experiments. (b) High K+ aCSF evoked adenosine release and depolarisation of BFB neurons. (c) NMDA application also evoked neuronal depolarisation and firing accompanied by subsequent release of adenosine and inosine. (d) Adenosine released was evoked after depolarisation with AMPA (d), by (1R,3S) ACPD with or without accompanying depolarisation (e,f), and Orexin A did not induce ADO release despite causing depolarisation (g).

