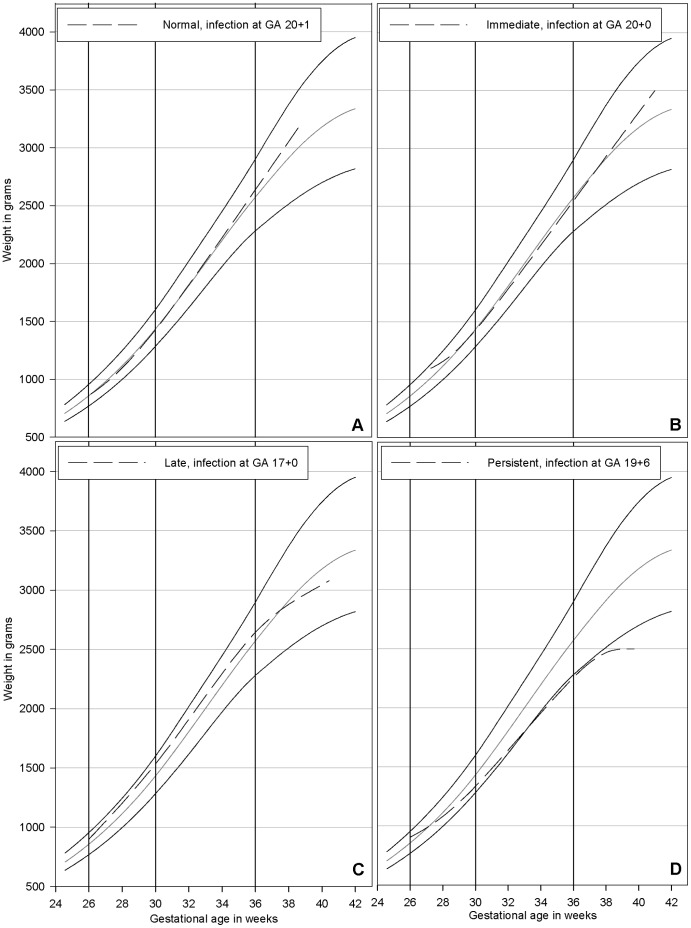
Figure 1. Different growth patterns after a malaria infection.
The four individual growth patterns are superimposed on a weight chart developed from healthy pregnancies in the cohort [31]. Normal growth observed after an infection at gestational age (GA) 20+1 (panel A). Immediate effect observed after an infection at GA 20+1 with an initial decline in growth observed in the growth interval antenatal visit (ANV)2– ANV3 followed by persistently normal growth until delivery (panel B). Late effect observed after an infection at a GA 17+0 with normal growth until ANV4 and thereafter a decline in growth until delivery (panel C). Persistent effect observed after an infection at GA 19+6 with decline in growth throughout pregnancy (panel D). The solid vertical lines indicate the timing of the three ANV. In panel B the ANV2 occurred slightly delayed at a GA of 27+2. The solid black and grey lines represent the 90th, 50th, and 10th percentile.

