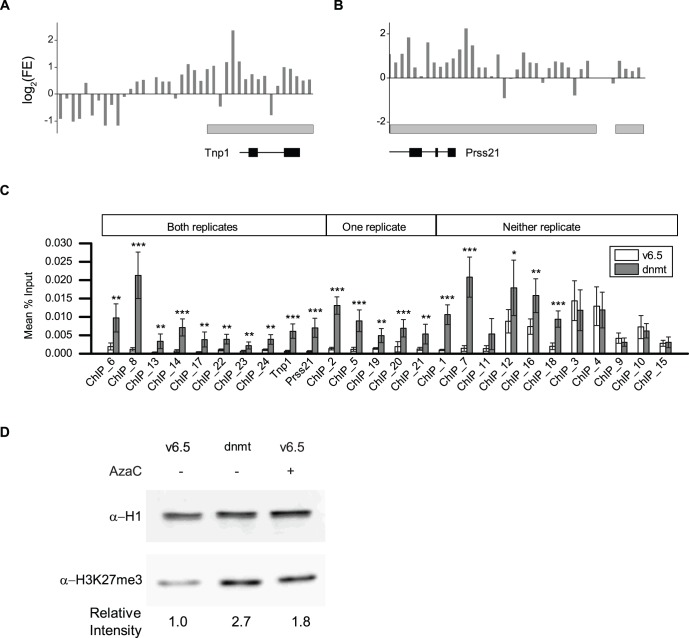
Figure 2. Increased H3K27me3 in DnmtTKO ES cells. a, b,
Average normalized fold enrichment of ChIP-seq reads in 100 bp bins in DnmtTKO cells relative to wildtype for two representative loci, Tnp1 (a) and Prss21 (b). ChIP-seq peaks are indicated by the grey bars and genes are indicated at the bottom. c, qPCR validation of ChIP-seq peaks. Each bar represents the average percent input immunoprecipitated for six biological replicate ChIP experiments using chromatin from wild type v6.5 cells or DnmtTKO. Note that all six ChIP experiments are independent of those used to generate the ChIP-seq libraries. Primers used in (c) are listed in Supplementary Table 4 (* p<.05, ** p<.01, *** p<.001). d, Western blot of acid-extracted histones from v6.5 (+ or - 5-AzaC) and DnmtTKO cells. H1 is used as a loading control. Relative intensity of anti-H3K27me3 bands is shown on the bottom. Quantification was done using imageJ and normalized to H1.

