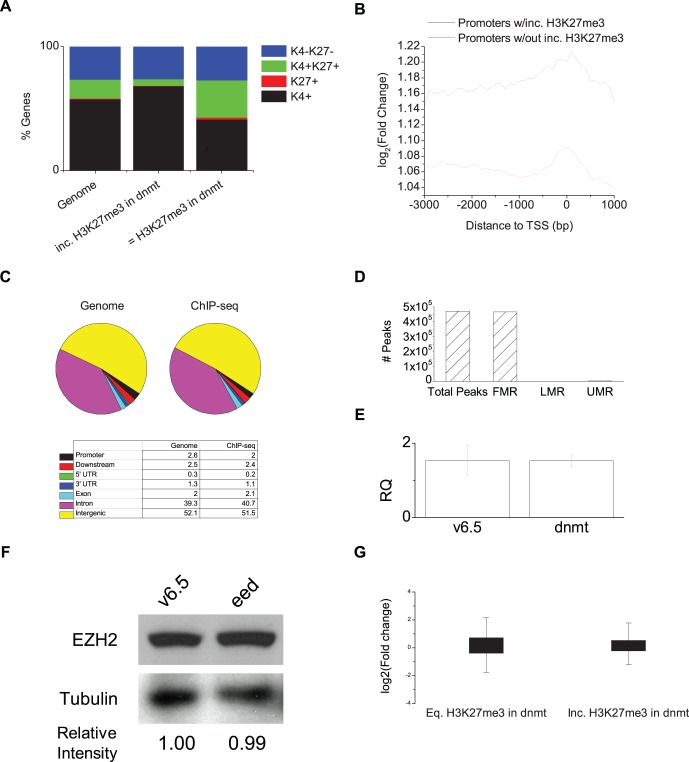
Figure 3. Global antagonism to H3K27me3 in DnmtTKO cells. a,
Classification of promoters identified in ChIP-seq experiment based on presence of H3K27me3 and H3K4me3 in wildtype cells. H3K4 and H3K27 methylation data from [5]. b, Profile of enrichment of ChIP-seq tags in 100 bp bins across the promoter for all genes with or without peaks of increased H3K27me3 in DnmtTKO cells. c, Distribution of ChIP-seq reads according to genomic features. d, Number of ChIP-seq peaks intersecting with either fully-, low- or unmethylated regions according to data from [26]. e, Expression level of Eed in v6.5 and DnmtTKO cells by qRT-PCR. f, Western blot analysis of EZH2 in v6.5 and DnmtTKO cells. Relative intensity of EZH2 band from calculated using ImageJ is shown on the bottom. Intensity levels of EZH2 are normalized to Tubulin. h, Boxplot of expression level change for genes enriched in H3K27me3 in DnmtTKO cells.

