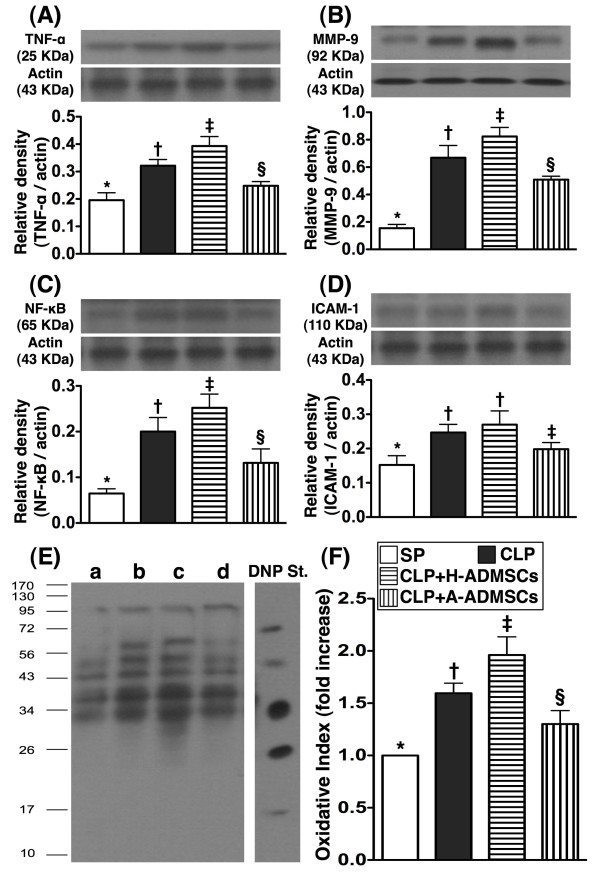
Figure 7.
Protein expressions of inflammatory and oxidative stress biomarkers of left ventricular myocardium at 72 h after CLP/SP.A, B and C) The protein expressions of tumor necrotic factor (TNF)-α (A), matrix metalloproteinase (MMP)-9 (B) and nuclear factor (NF)-κB (C) exhibited an identical pattern amongst the four groups. * vs. other bars with different symbols, p < 0.0001. D) The protein expression of intercellular adhesion molecule (ICAM)-1. * vs. other bars with different symbols, p < 0.0001. E &F) Expression of protein carbonyls (i.e., oxidized protein), an oxidative index, in the four groups of animals [Note: Right lane and left lane shown on left lower panel (E) representing control oxidized molecular protein standard and protein molecular weight marker, respectively]. DNP = 1-3 dinitrophenylhydrazone. * vs. other bars with different symbols, p < 0.0001. a = SP control; b = CLP; c = CLP + H-ADMSCs; d = CLP + A-ADMSCs. All statistical analyses used one-way ANOVA, followed by Bonferroni multiple comparison post hoc test. Symbols (*, †, ‡, §) indicating significance (at 0.05 level). CLP = cecal ligation and puncture; Normal indicates sham procedure; H-ADMSCs = healthy adipose-derived mesenchymal stem cells; A-ADMSCs = apoptotic adipose-derived mesenchymal stem cells.

