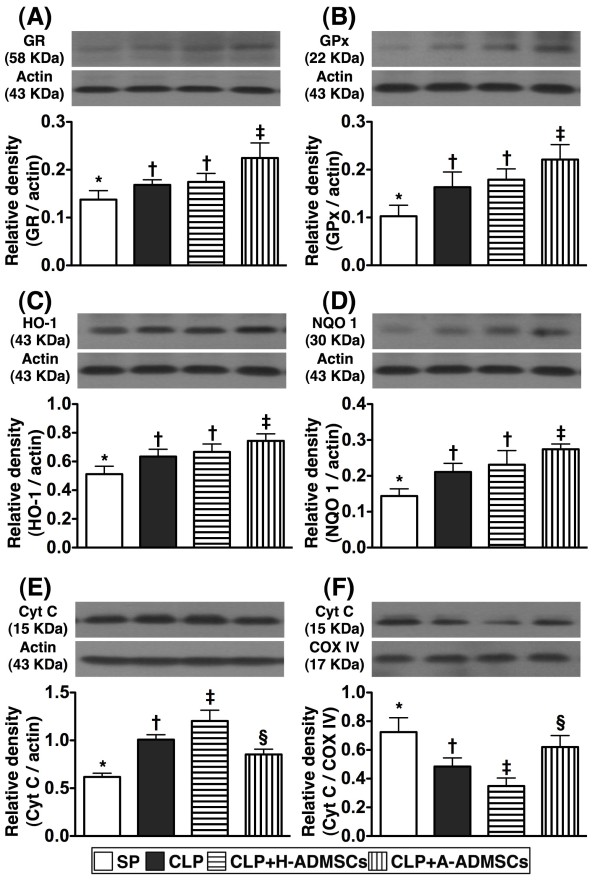
Figure 9.
Protein expressions of anti-oxidant and mitochondrial preservation biomarkers of left ventricular myocardium at 72 h after CLP/SP.A, B, C and D) The protein expressions of glutathione reductase (GR) (A) glutathione peroxidase (GPx) (B), heme oxygenase (HO)-1 (C) and NAD(P)H quinone oxidoreductase (NQO) 1 (D) displayed an identical pattern amongst the four groups. * vs. other bars with different symbols, p < 0.001. E &F) Protein expression of cytosolic (E) and mitochondrial (F) cytochrome C (Cyt C). * vs. other bars with different symbols, p < 0.001. All statistical analyses used one-way ANOVA, followed by Bonferroni multiple comparison post hoc test. Symbols (*, †, ‡, §) indicating significance (at 0.05 level). CLP = cecal ligation and puncture; Normal indicates sham control; H-ADMSCs = healthy adipose-derived mesenchymal stem cells; A-ADMSCs = apoptotic adipose-derived mesenchymal stem cells.

