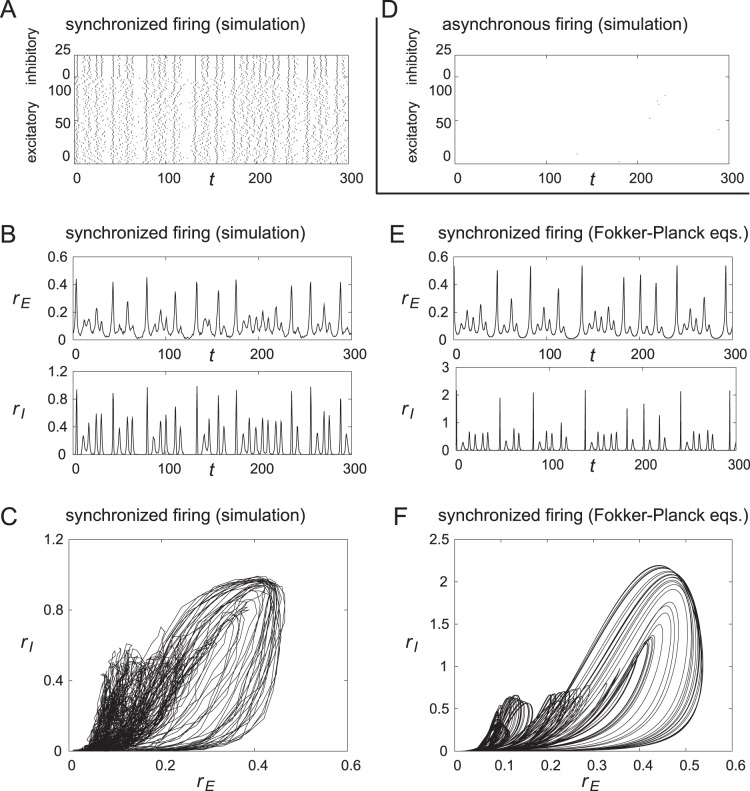
Figure 4. Results of simulations in a unit.
(A), (B), and (C) Chaotic synchronization observed in a unit model with  PYRs and
  INs. The values of the parameters are
  ,
,  ,
,  ,
,  ,
,  ,
,  ,
,  ,
,  ,
,  , and
, and  . (A) Raster plot of spikes of 100 PYRs and 25 INs (randomly chosen). The firing times of neurons have correlations and we call such firing synchronized. (B) Temporal changes in instantaneous firing rates
  and
and  of the excitatory ensemble
  and the inhibitory ensemble
  , respectively, calculated from the firing in Figure A. It is observed that
  and
and  fluctuate, and it is found that this fluctuation is caused by chaotic dynamics and not by a stochastic one. (C) Trajectory in the (
 ,
,  ) plane obtained from the data in Figure B. It is observed that the trajectory has some complex structure. (D) Asynchronous firing observed in this unit. Raster plot of spikes of 100 PYRs and 25 INs (randomly chosen). The number of firing is very few because the firing rates are low. (E) and (F) Chaotic synchronization in a unit with an infinite number of neurons obtained by analysis with Fokker-Planck equations, which corresponds to the results in Figures B and C obtained in a unit with a finite number of neurons. (E) Temporal changes in the instantaneous firing rates
  and
and  . The results are similar to those in Figure B. (F) Trajectory in the (
 ,
,  ) plane. A fine structure of a chaotic attractor is visible.

