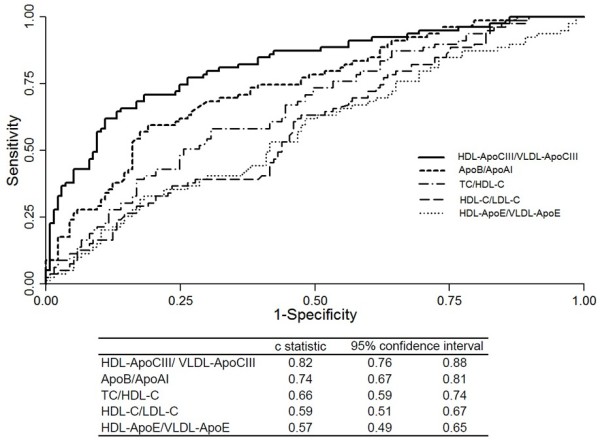
Figure 2.

(a) Graph showing the ratio of high-density lipoprotein (HDL)–apolipoprotein (Apo) CIII to very-low-density lipoprotein (VLDL)–ApoCIII in study groups categorized by total cholesterol (TC) and triglyceride (TG) levels. Each study group was further divided according to the presence of coronary artery disease (CAD, black bar; non-CAD, white bar). Values are presented as the mean ± standard error of the mean; †P<0.01 for CAD vs. non-CAD. NL, normolipidemic; HTG, hypertriglyceridemic; HC, hypercholesterolemic; HLP, hyperlipidemic. (b) Flow diagram proposing the use of the HDL-ApoCIII/VLDL-ApoCIII ratio as a predictor for CAD in the general population.
