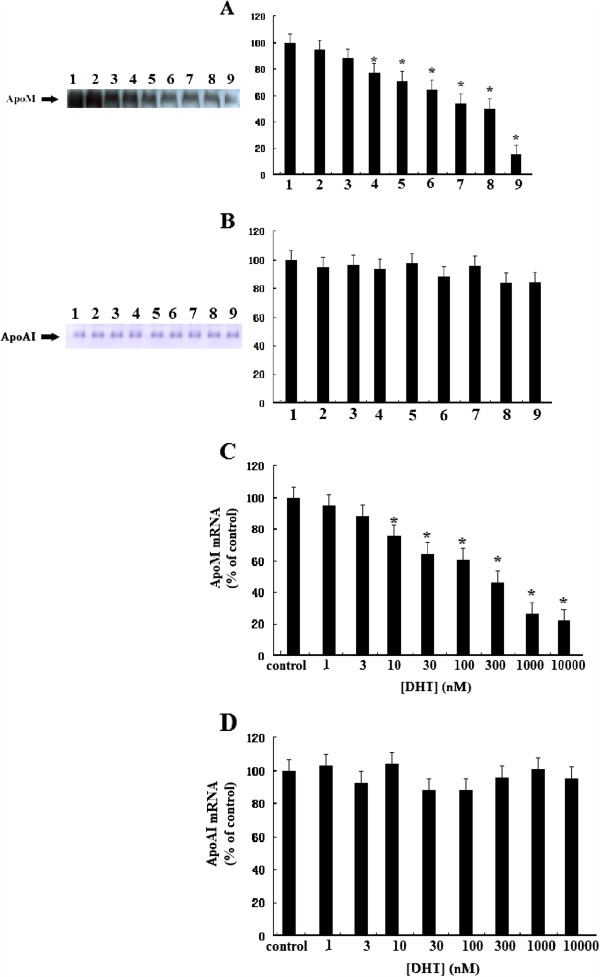
Figure 1.
Effect of DHT on secretion and expression of ApoM and ApoAI. HepG2 cells were incubated in 2 ml of DMEM containing 10% FBS until subconfluency was achieved. Medium was then changed to 2 ml of medium containing 10% CTFBS and various concentrations of DHT (0, 1, 3, 10, 30, 100, 300, 1000, 10000nM) and incubated for 24 h. ApoM and ApoAI levels were determined by western blotting analysis (A, B), ApoM and ApoAI mRNA levels were determined by RT-PCR (C, D) as described in “Materials and methods.” Data are expressed relative to the control group (100%). Data are represented as means ± S.D. (n = 6 for each sample group). Lane 1, control group, lanes 2–9, DHT concentrations of 1, 3, 10, 30, 100, 300, 1000 and 10000nM respectively. *P < 0.05 vs. control group.

