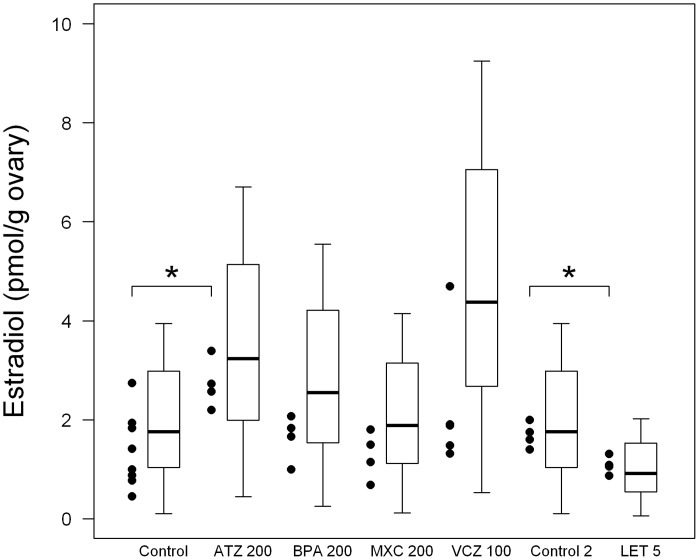
Figure 5. Experimental data vs predictions of estradiol levels in control and EDC-treated female rats at the diestrus stage.
Experimental data are represented by points (n = 8 for control data, n = 4 for EDC-treated animals data). Statistical distributions of the model predictions are represented by boxplots (showing the distribution quartiles). Control is for atrazine 200 mg/kg, bisphenol A 200 mg/kg, and vinclozolin 100 mg/kg; control 2 is for letrozole 5 mg/kg. ATZ: atrazine; BPA: Bisphenol A; MXC: methoxychlor; VCZ: vinclozolin; LET: letrozole.

