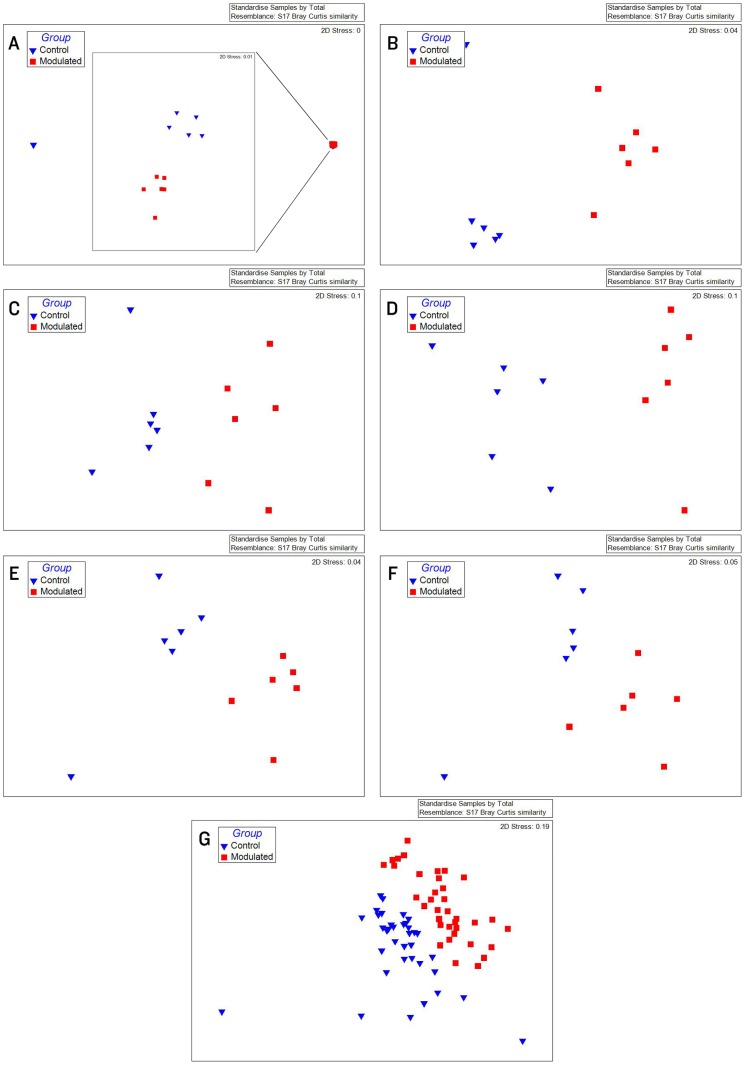
Figure 5. MDS plots for upper respiratory samples show successful modulation of respiratory microbial communities.
MDS plots of upper respiratory microbiome samples A) the day of M. hyopneumoniae infection (69 days of age) (R = 0.667, p = 0.002), B) 7 days after M. hyopneumoniae infection (R = 0.763, p = 0.002), C) 9 days after M. hyopneumoniae infection (R = 0.704, p = 0.002), D) 12 days after M. hyopneumoniae infection (R = 0.807, p = 0.002), E) 14 days after M. hyopneumoniae infection (R = 0.719, p = 0.002) and F) 21 days after M. hyopneumoniae infection (R = 0.576, p = 0.002). G) MDS plot of all upper respiratory microbiome samples taken at multiple time points throughout the study (R = 0.368, p = 0.001).

