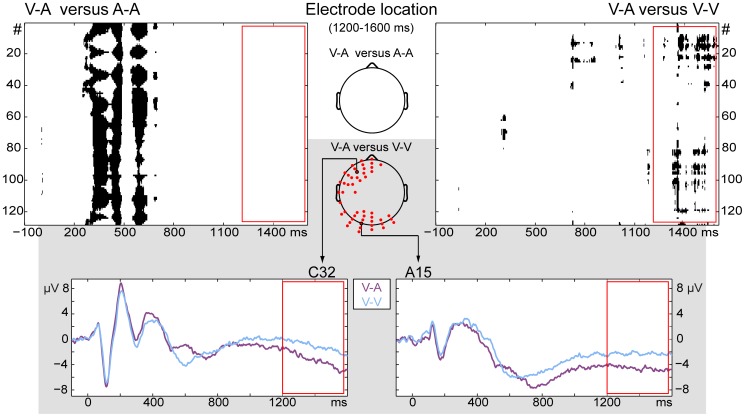
Figure 3. Potential differences between the cross-modal and unimodal conditions.
Top row: Topographic comparison between V-A and A-A, and V-A and V-V (significant differences shown in black for all electrodes over time). During the time period 1200–1600 ms (red rectangle), V-A only showed differences with V-V. Brain responses during V-A were more negative than during Vis-Vis in that time period. Scalps in the middle show the location of the electrodes that were different during that period for at least 5% of the time. For the comparison of V-A with V-V, the differences were located in left-frontal and occipital areas. Grey rectangle: Event-related potentials of electrodes selected for display because of their central location in the two areas of significant difference.

