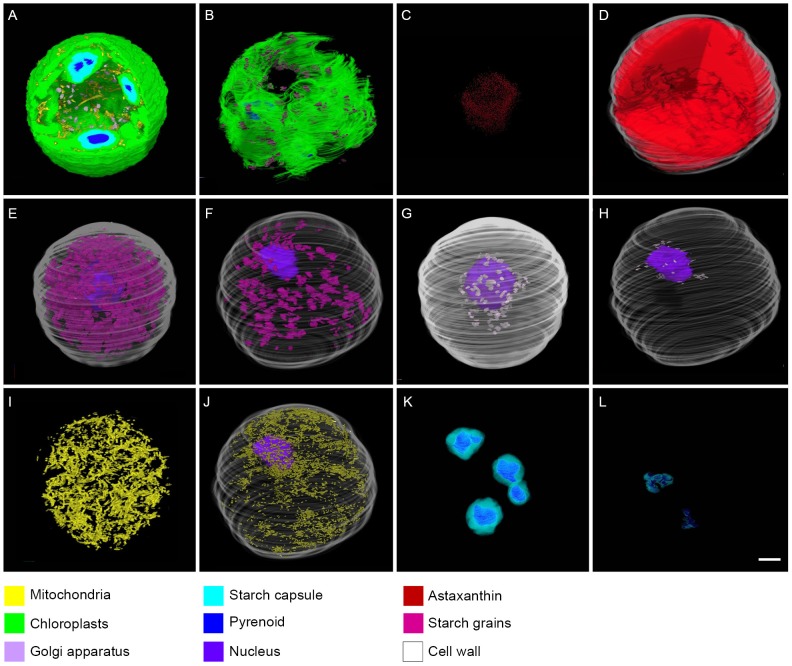
Figure 5. 3D TEM images of subcellular components.
A, C, E, G, I, and K represent a green coccoid cell; B, D, F, H, J, and L represent a cyst cell. A and B. 3D reconstruction of chloroplasts with pyrenoids, mitochondria, and/or starch grains. C and D. 3D reconstruction of astaxanthin distribution. E and F. 3D reconstruction of starch grains with the nucleus. G and H. 3D reconstruction of Golgi bodies with the nucleus. I and J. 3D reconstruction of mitochondria (with the nucleus in J). K and L. 3D reconstruction of pyrenoids and starch capsules. All subcellular components are denoted by different colors as indicated in the color legends. Scale bar in all images: 5 µm.

