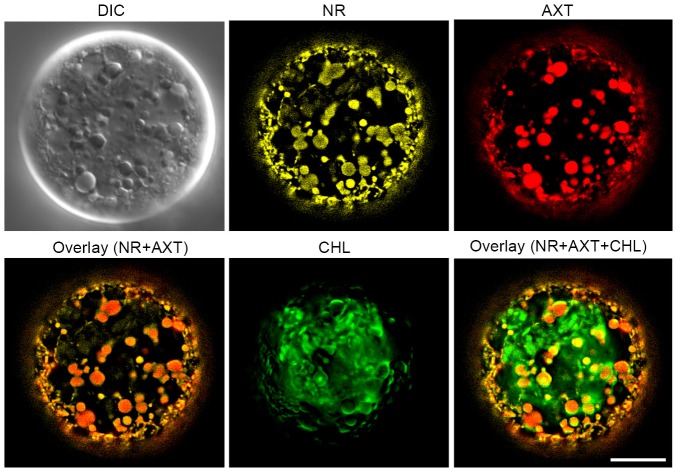
Figure 7. interference contrast (DIC) image and subcellular localization of lipids, astaxanthin, and chlorophyll in an astaxanthin-rich H. pluvialis cell.
Nile Red (NR) signal, astaxanthin (AXT), and chlorophyll (CHL) autofluorescence are yellow, red, and green, respectively. Two overlaid images (NR+AXT and NR+AXT+CHL) are shown. Note that the Nile Red signals are colocalized with astaxanthin, shown in orange. Scale bar: 10 µm.

