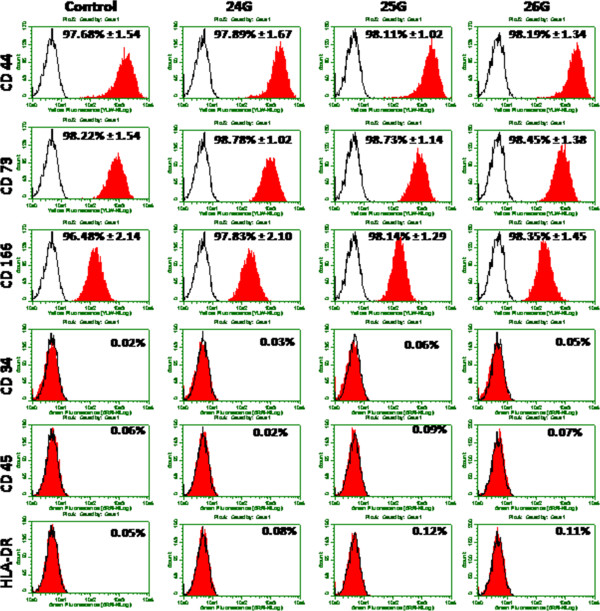
Figure 2.

Detection of surface marker expression of BM-MSCs: Phenotypic expression of BM-MSCs after ejected via different bore size needles along with control cells were analyzed by flow cytometry. An open area represents an antibody isotype control for background fluorescence and a shaded area shows signal from MSC surface marker antibodies. Representative histograms are depicted.
