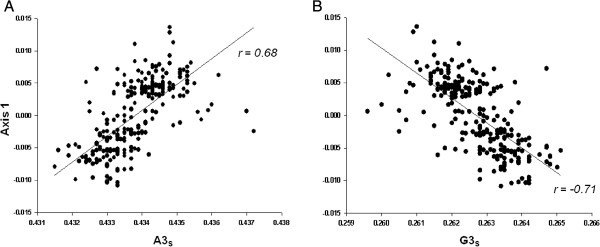
Figure 1.
Association of purines at third codon positions with dimensional factor 1 generated by COA. In (A) and (B), the regression plots of the frequency of A3s and G3s versus the respective position of each strain in the first dimensional factor generated by the correspondence analysis on RSCU (COA-RSCU) are shown.

