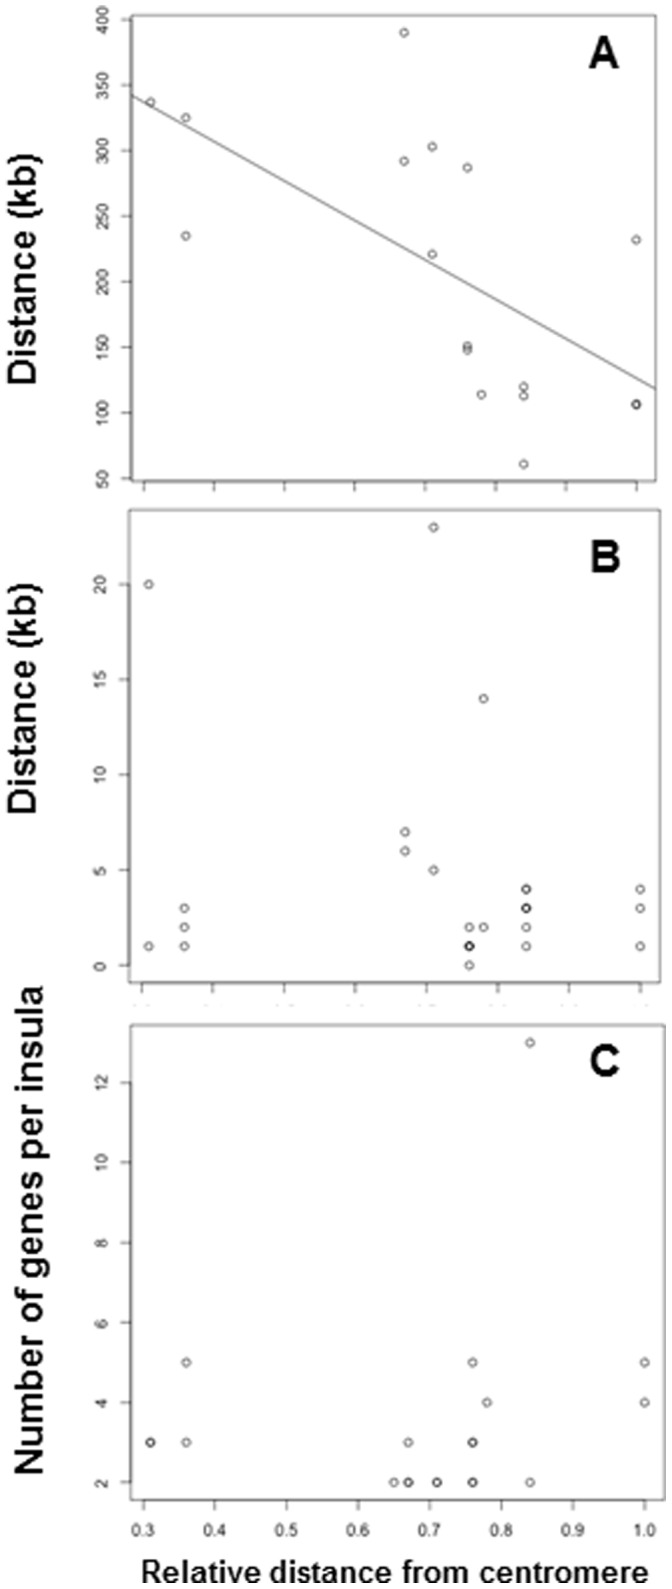
Figure 2. Relationships between inter-insular distances (A), intra-insular distances (B) and the number of genes per insula (C) and gene location along the centromere-telomere axes of Ae. tauschii chromosome arms.

(A) shows a fitted regression line from Model (7) of the inter-insular distances and gene location on centromere-telomere axes of Ae. tauschii chromosome arms.
