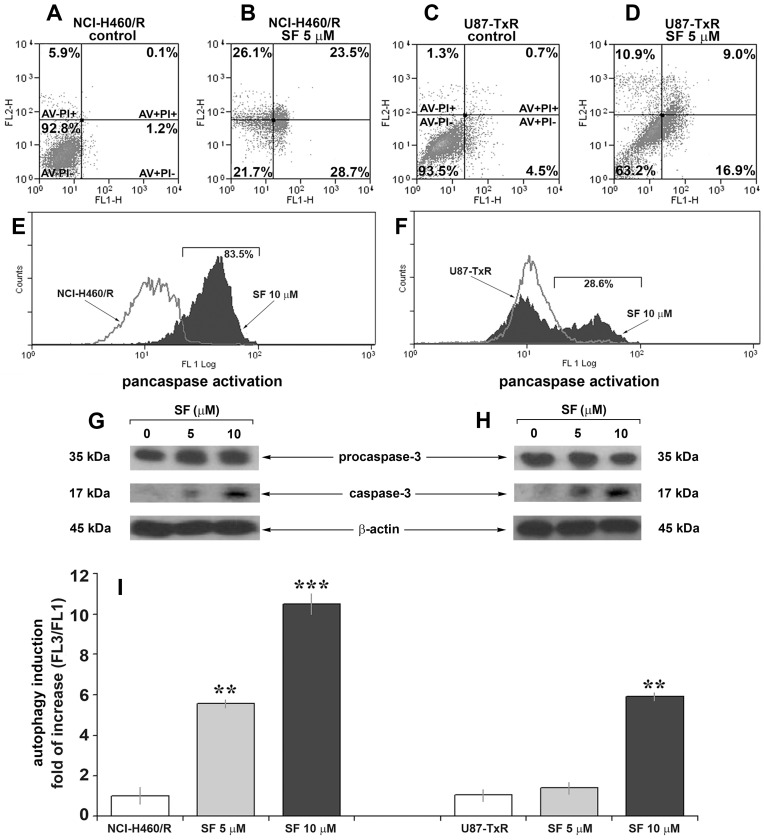
Figure 3. SF induces caspase activation, apoptosis and autophagy in MDR cancer cell lines.
Cell death analysis of NCI-H460/R (A) and U87-TxR (C) cells untreated and treated with 5 µM SF (B, D) for 72 h. The samples were analyzed for green fuorescence (Annexin-V-FITC) and red fluorescence (Propidium Iodide) by flow-cytometry. The assay distinguishes viable cells (AV− PI−), apoptotic cells (AV+ PI−), late apoptotic and necrotic cells (AV+ PI+) and secondary necrotic or dead cells (AV− PI+). Pancaspase activation in NCI-H460/R (E) and U87-TxR (F) cells untreated and treated with 10 µM SF was assessed after 72 h by flow-cytometry. The cells were labelled with a cell-permeable, FITC-conjugated pan-caspases inhibitor (ApoStat). Western blot analysis of procaspase-3, p17 cleaved caspase-3 and β-actin in NCI-H460/R (G) and U87-TxR (H) cells. (I) The autophagy in NCI-H460/R and U87-TxR cell lines assessed after 144 h incubation period (72 h of SF treatment followed by next 72 h of cell recovery in fresh medium). Fold of increase in red vs. green (FL3/FL1) fluorescence ratio after acridine orange-staining was determined using a FacsCalibur flow cytometer and Cell Quest Pro software. The statistical significance between the controls and treatments is presented as p<0.01 (**) and p<0.001 (***).

