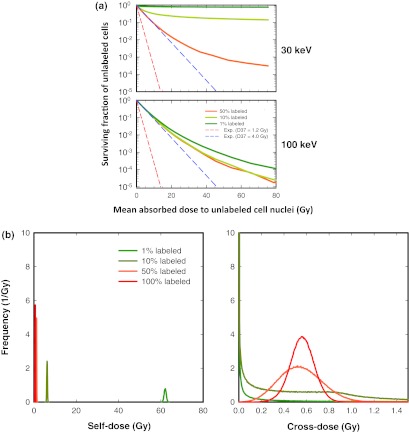
Figure 2.
(a). Effect of energy and fraction of cells labeled on the shape of the survival curve for the unlabeled cell population when monoenergetic electron emitters are uniformly distributed among the labeled cells. (Top) 30 keV. (Bottom) 100 keV. The surviving fraction of unlabeled cells is plotted as a function of mean absorbed dose to the unlabeled cell nuclei. The survival curves are shown for three different labeled fractions: 50%, 10%, and 1% (no unlabeled cells at 100%). The lower and upper dashed lines represent exponential survival curves with D37 = D37,self = 1.2 Gy and D37 = D37,cross = 4.0 Gy, respectively. A complete set of curves including 10, 30, 100, 300, and 1000 keV is provided in Fig. 2 of the supplementary material (B) (Ref. 50). (b) Frequency distribution of self- (Left) and cross-doses (Right) received by cells when a 30 keV monoenergetic electron emitter is distributed uniformly among 100%, 50%, 10%, or 1% of the cells. The Monte-Carlo simulation that generated this distribution transported 3 × 10⁸ histories for a mean total dose of 1.17 Gy per cell.

