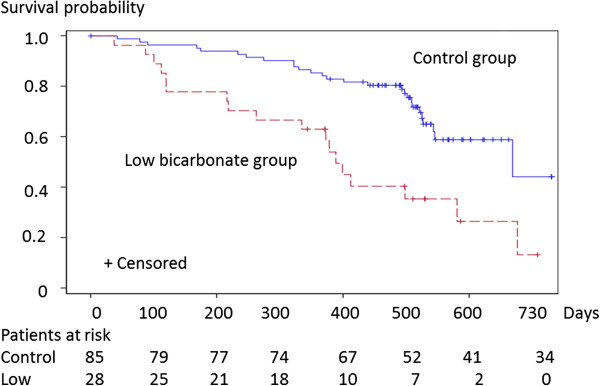
Figure 1.
Kaplan-Meier analysis of CKD-progression-free-survival in low-bicarbonate group compared with control group. The numbers of patients at risk of the outcome are indicated beneath the graph. Abbreviations: CKD progression, reaching the outcome; Survival probability, probability of being CKD-progression-free.

