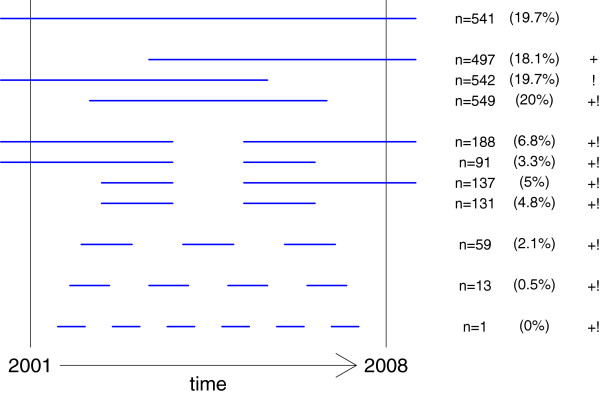
Figure 1.
Number of patients by pattern of treatment history, 2001–2008. Each line represents a pattern of treatment history with the number and proportion of patients exhibiting this pattern. The length of the line is not proportional to the duration of treatment, only the fact that the line is cutting or not the lower or the upper limit of the observation (January 1st 2001, June 30, 2008) is of interest. For example, - the first line represents the pattern “having had one treatment episode, beginning before January 1st, 2001, and ending after June 30th 2008”, n =541 (19.7%). - the second line represents the pattern “having had only one treatment episode, beginning between January 1st, 2001, and ending after June 30th, 2008”, n = 497 (18.1%). - the last line represents the pattern “having had more than 4 treatments episodes beginning after January 1st, 2001, ending before June 30th, 2008”, n = 1 (0.0%). + group of individuals included in the analysis of treatment duration. ! group of individuals included in the analysis of treatment interruption.

