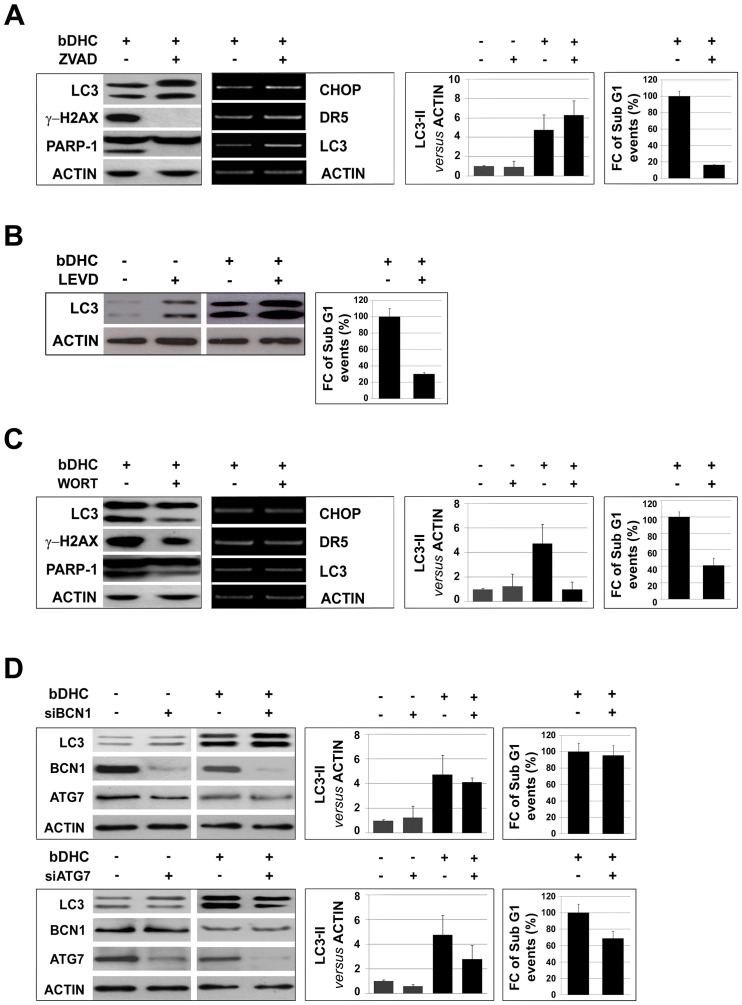
Figure 7. Autophagy activation leads to cell death.
A. Left panels: LC3, γ-H2AX and PARP1 levels in bDHC cells co-treated with ZVAD. Middle left panel: RT-PCR analysis of the indicated genes normalized versus actin mRNA expression. Middle right panel: LC3-II levels versus actin with or without co-treatment. Right panels: Flow cytometric analysis of SubG1 events in cells with or without co-treatments. Data are reported as fold change (FC) of SubG1 population relative to bDHC-treated cells (arbitrarily set at 100%). B. Left panel: Western blot analysis of LC3 and actin levels following 24 hours co-treatment of DMSO or bDHC with LEVD. Right panel: Fold change (FC) of SubG1 events in cells co-treated with LEVD and bDHC versus bDHC-treated cells (arbitrarily set at 100%). C. Left panels: LC3, γ-H2AX and PARP1 levels in bDHC cells co-treated with Wortmannin (WORT). Middle left panel: mRNA levels of the indicated genes normalized versus actin. Middle right panel: Expression levels of LC3-II normalized to actin with or without co-treatment. Right panels: Flow cytometric analysis of SubG1 events in cells with or without Wortmannin. Data are reported as fold change (FC) of SubG1 population relative to bDHC-treated cells (arbitrarily set at 100%). D. Left panels: Western blot analysis of LC3, Beclin1 (BCN1) and Atg7 expression levels in DMSO and bDHC treated cells following BCN1 (upper panel) and Atg7 (lower panel) knock down. Middle panels: LC3-II levels in control, BCN1 and Atg7 inactivated cells have been normalized versus actin levels. Values are mean of three independent experiments −/+ SD. Right panels: Fold change (FC) of SubG1 events of BCN1 and Atg7 inactivated bDHC-cells versus bDHC-treated cells (arbitrarily set at 100%).

